- Search helps you find the data of a certain gene or sequence, and look at scores from both Transcript and Genetic view.
- Browse views the entire distribution of scores on a genetic level.
- Alignment allows you to compare two or three data.
- Predict is for prediction of RNA secondary structure based on sequence and scores.
- Statistics contains reagent and principle of each paper and their access.
- Download provides both the processed scores and original RT files.
- Firstly let's look at the '
 ' button in the menu bar on the left. As the button clicked, you may see the following interface:
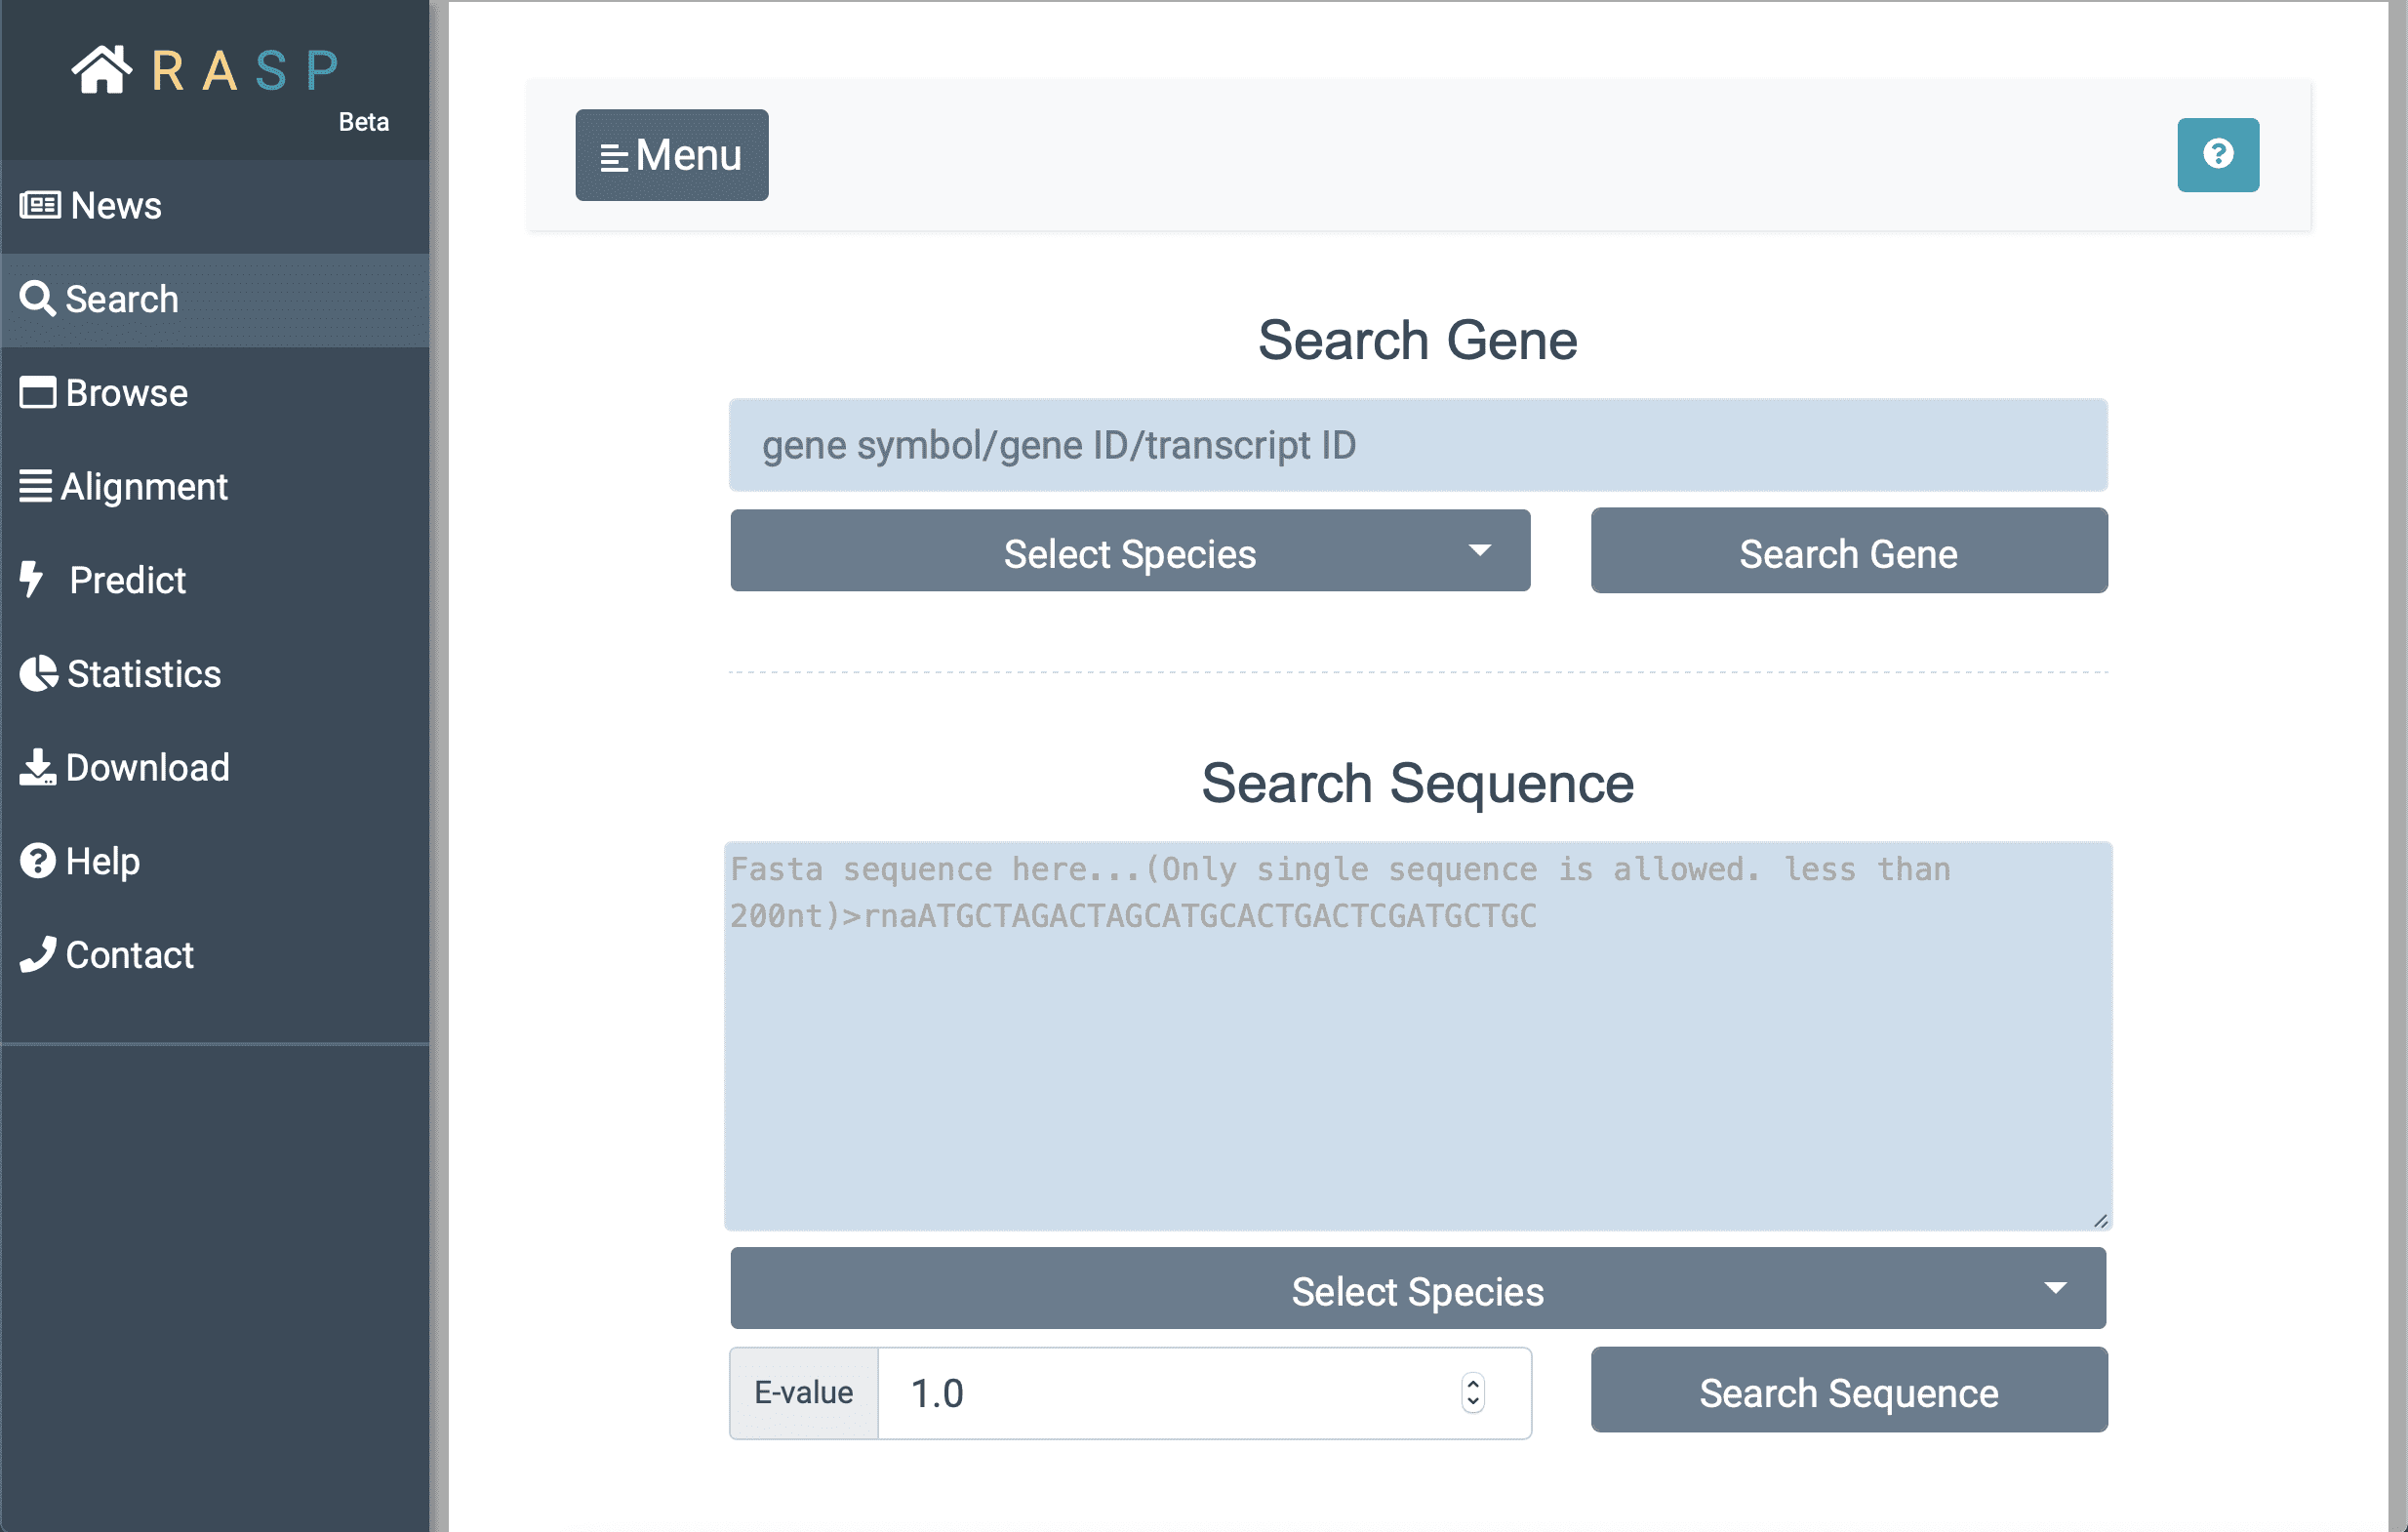
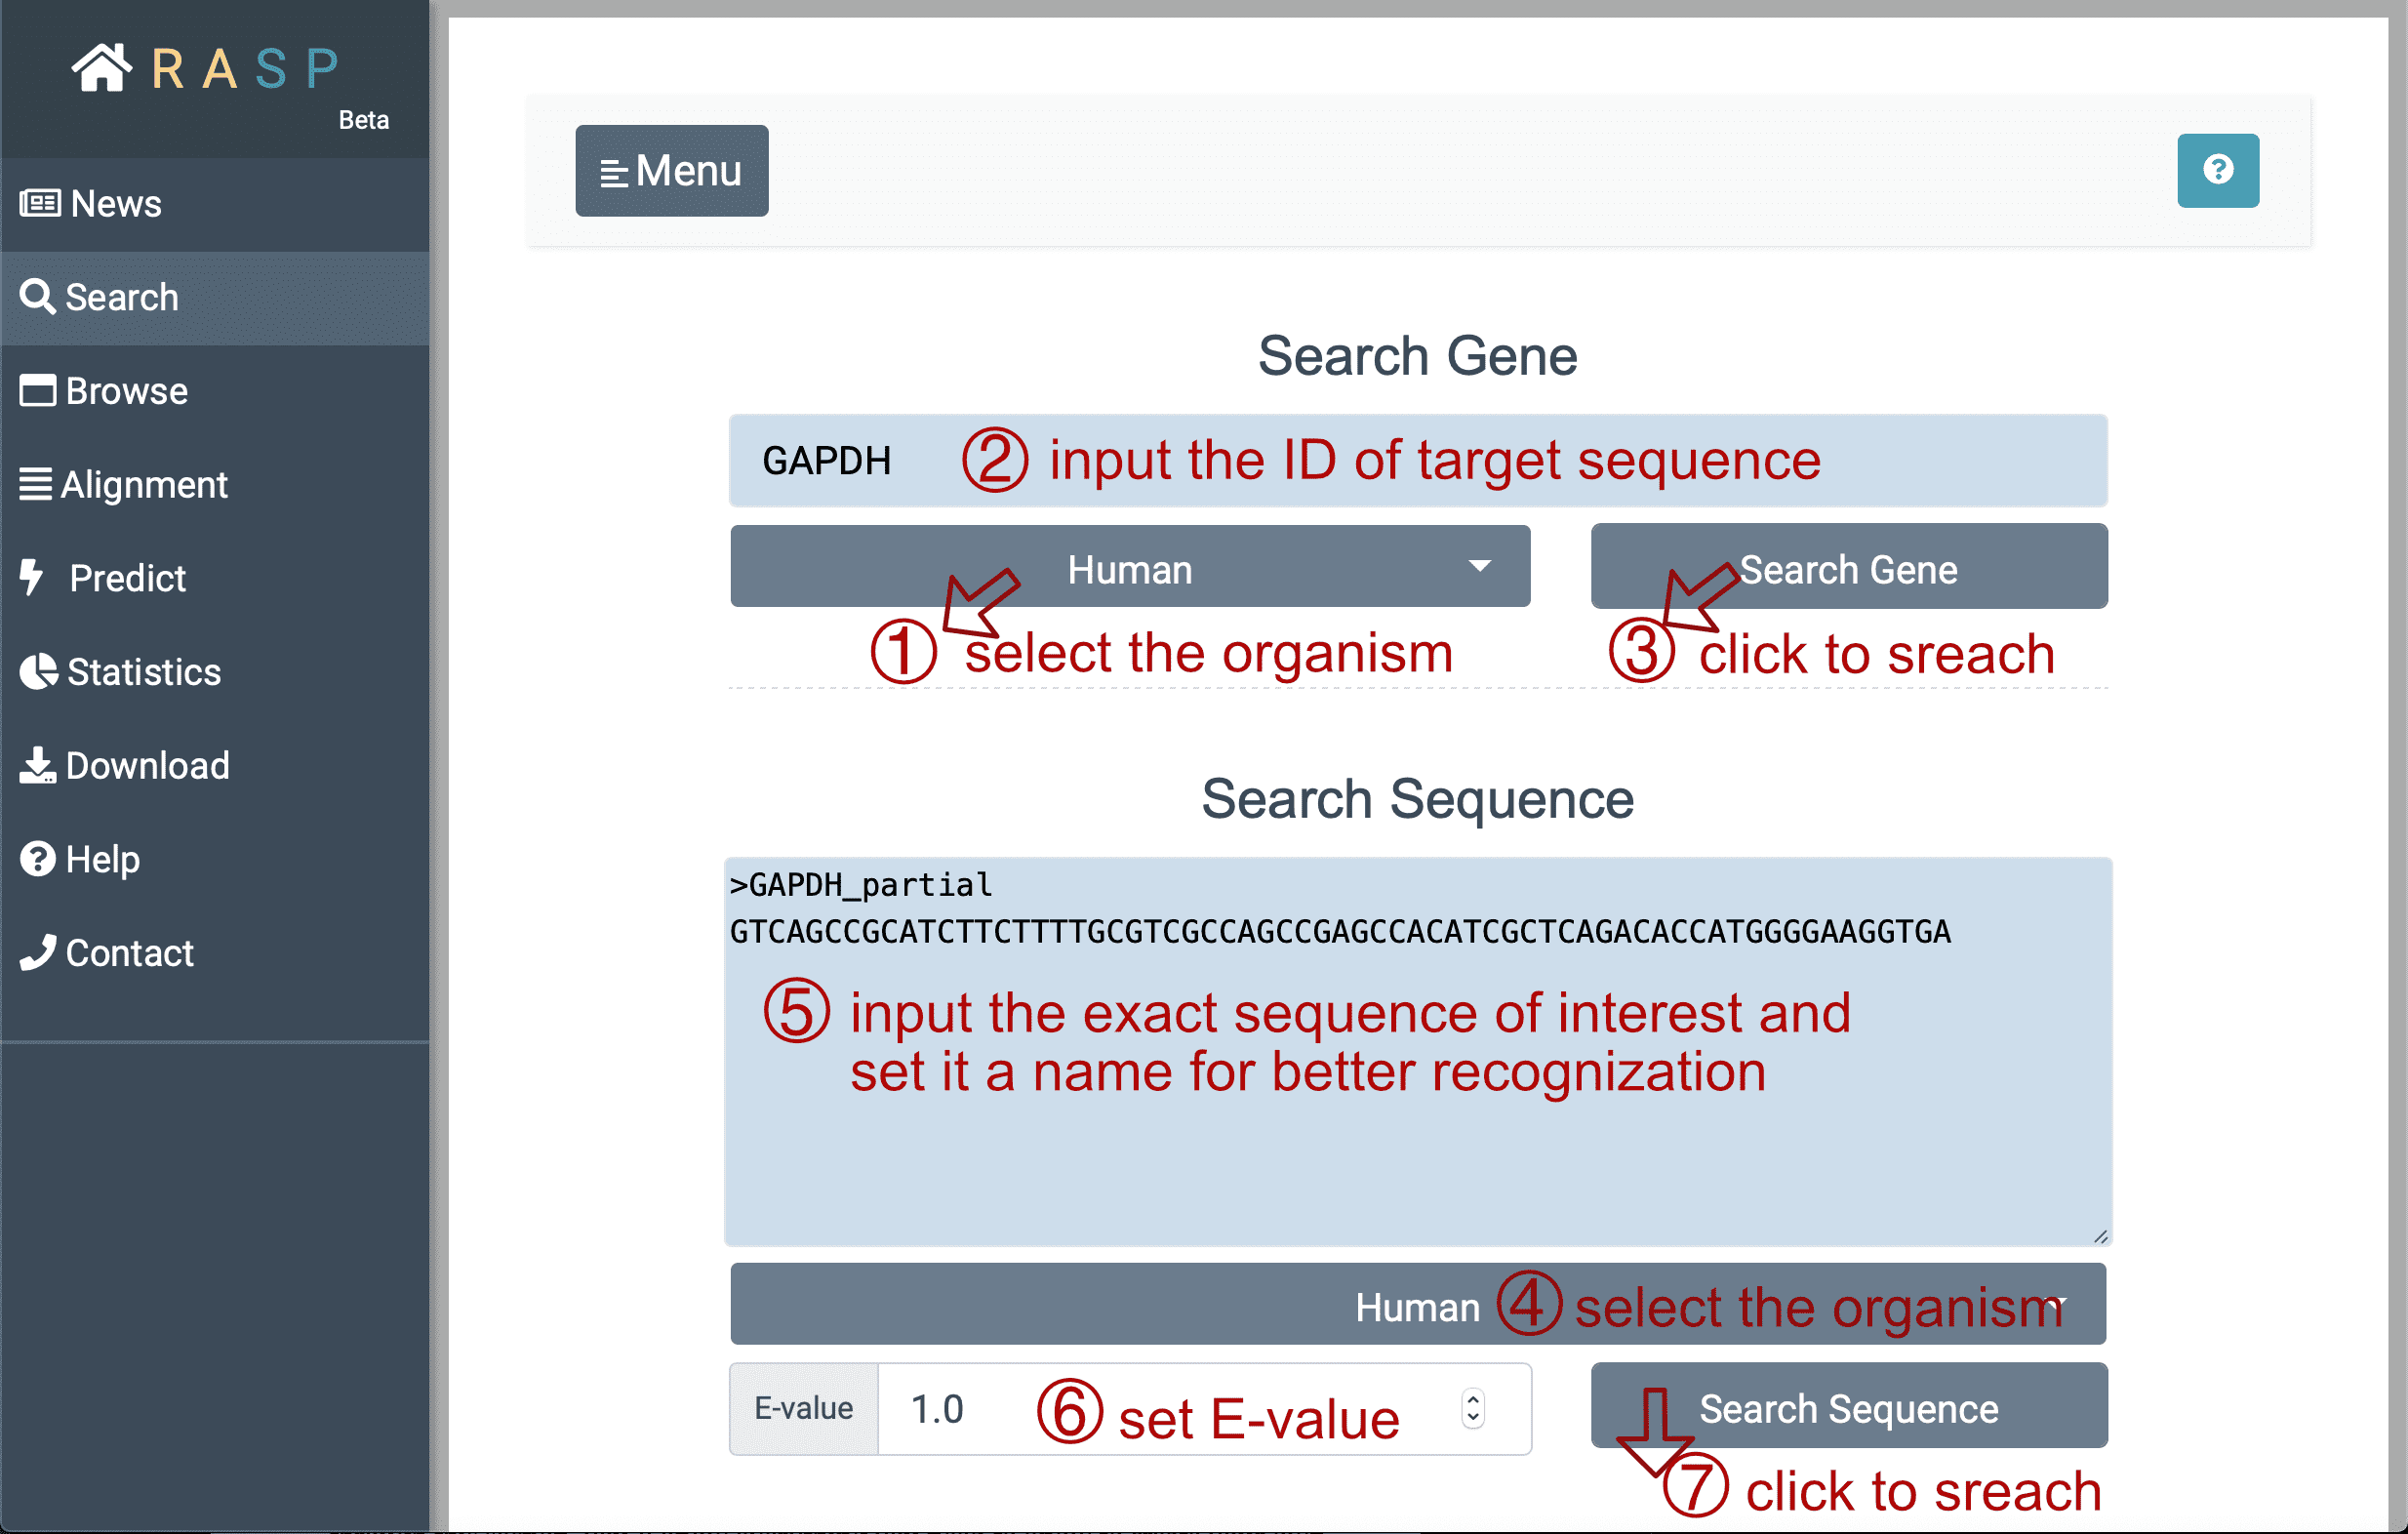
- Next, with ① selecting species "Human" (for example) , and inputting the gene ID (here we search 'GAPDH' for instance) you want to search for in②, you could then ③ click the botton "Search Gene" to find out the result. Or perhaps, if the exact sequence of interest is given, it could be directly put into the window "Search Sequence" through steps ④ > ⑤ > ⑥ > ⑦ just as what could be done in "Search Gene". The E-value at the bottom, is a parameter that describes the number of hits that "expect" to be accidentally seen when searching for a sequence of a particular size, and it can be set according to your needs.
- Now, with the "Search Gene" / "Search Sequence" button clicked, you may see the following window:
- Let's first look at '
 '. In this window, the color of each base varies according to its reactivity score. Of course, the data, containing this transcript, needs to be selected first, otherwise the color of all bases will be uniformed as black, which means NULL.
 - Now we move to '
 '. Click "Select paper" to select the target article, and then "Select dataset" to choose which sample to use. After loading data, the detail of sample used can be seen, and the score of each base is shown in "Sequence".
 - Here below are several operations you could make after sequence selected.
- If you want to compare differences between two or three data, ⑥ '
 ' will help you a great deal.
 - Except for adding to alignment, we also provide ⑦ '
 ' function.
 - There are two ways to select data
- Now let's move to the display of tracks
- Alignment
- Predict

Welcome to RASP
Welcome to RASP! RASP (RNA Alatas of Structure Probing) is a transcriptome-scale RNA structure probing database. Currently, RASP contains 161 deduplicated transcriptome-wide RNA secondary structure probing datasets from 38 papers. RASP covers 18 species across animals, plants, bacteria, fungi, and also viruses, and categorizes 18 experimental methods including DMS-Seq, SHAPE-Seq, SHAPE-MaP, and icSHAPE, etc. RASP also provides a user-friendly interface to query, browse, and visualize RNA structure profiles, offering a shortcut to accessing RNA secondary structures grounded in experimental data.
Here as to make RASP help you better, we've prepared this tutorial inducing how it works each step. Let's begin!
How to Use RASP ?
This tutorial is divided into six main sections, each matching the column of the menu bar on the left side of the website.
If you're new to RASP, work your way through the following tutorial will help a great deal and then you could start your own project without hindrance. Watch the Tutorial video to learn how to search icSHAPE data and predict secondary structure.
1. How to Search ?
|
Note: Remember to close the options window after you've decided which organism to search for. |
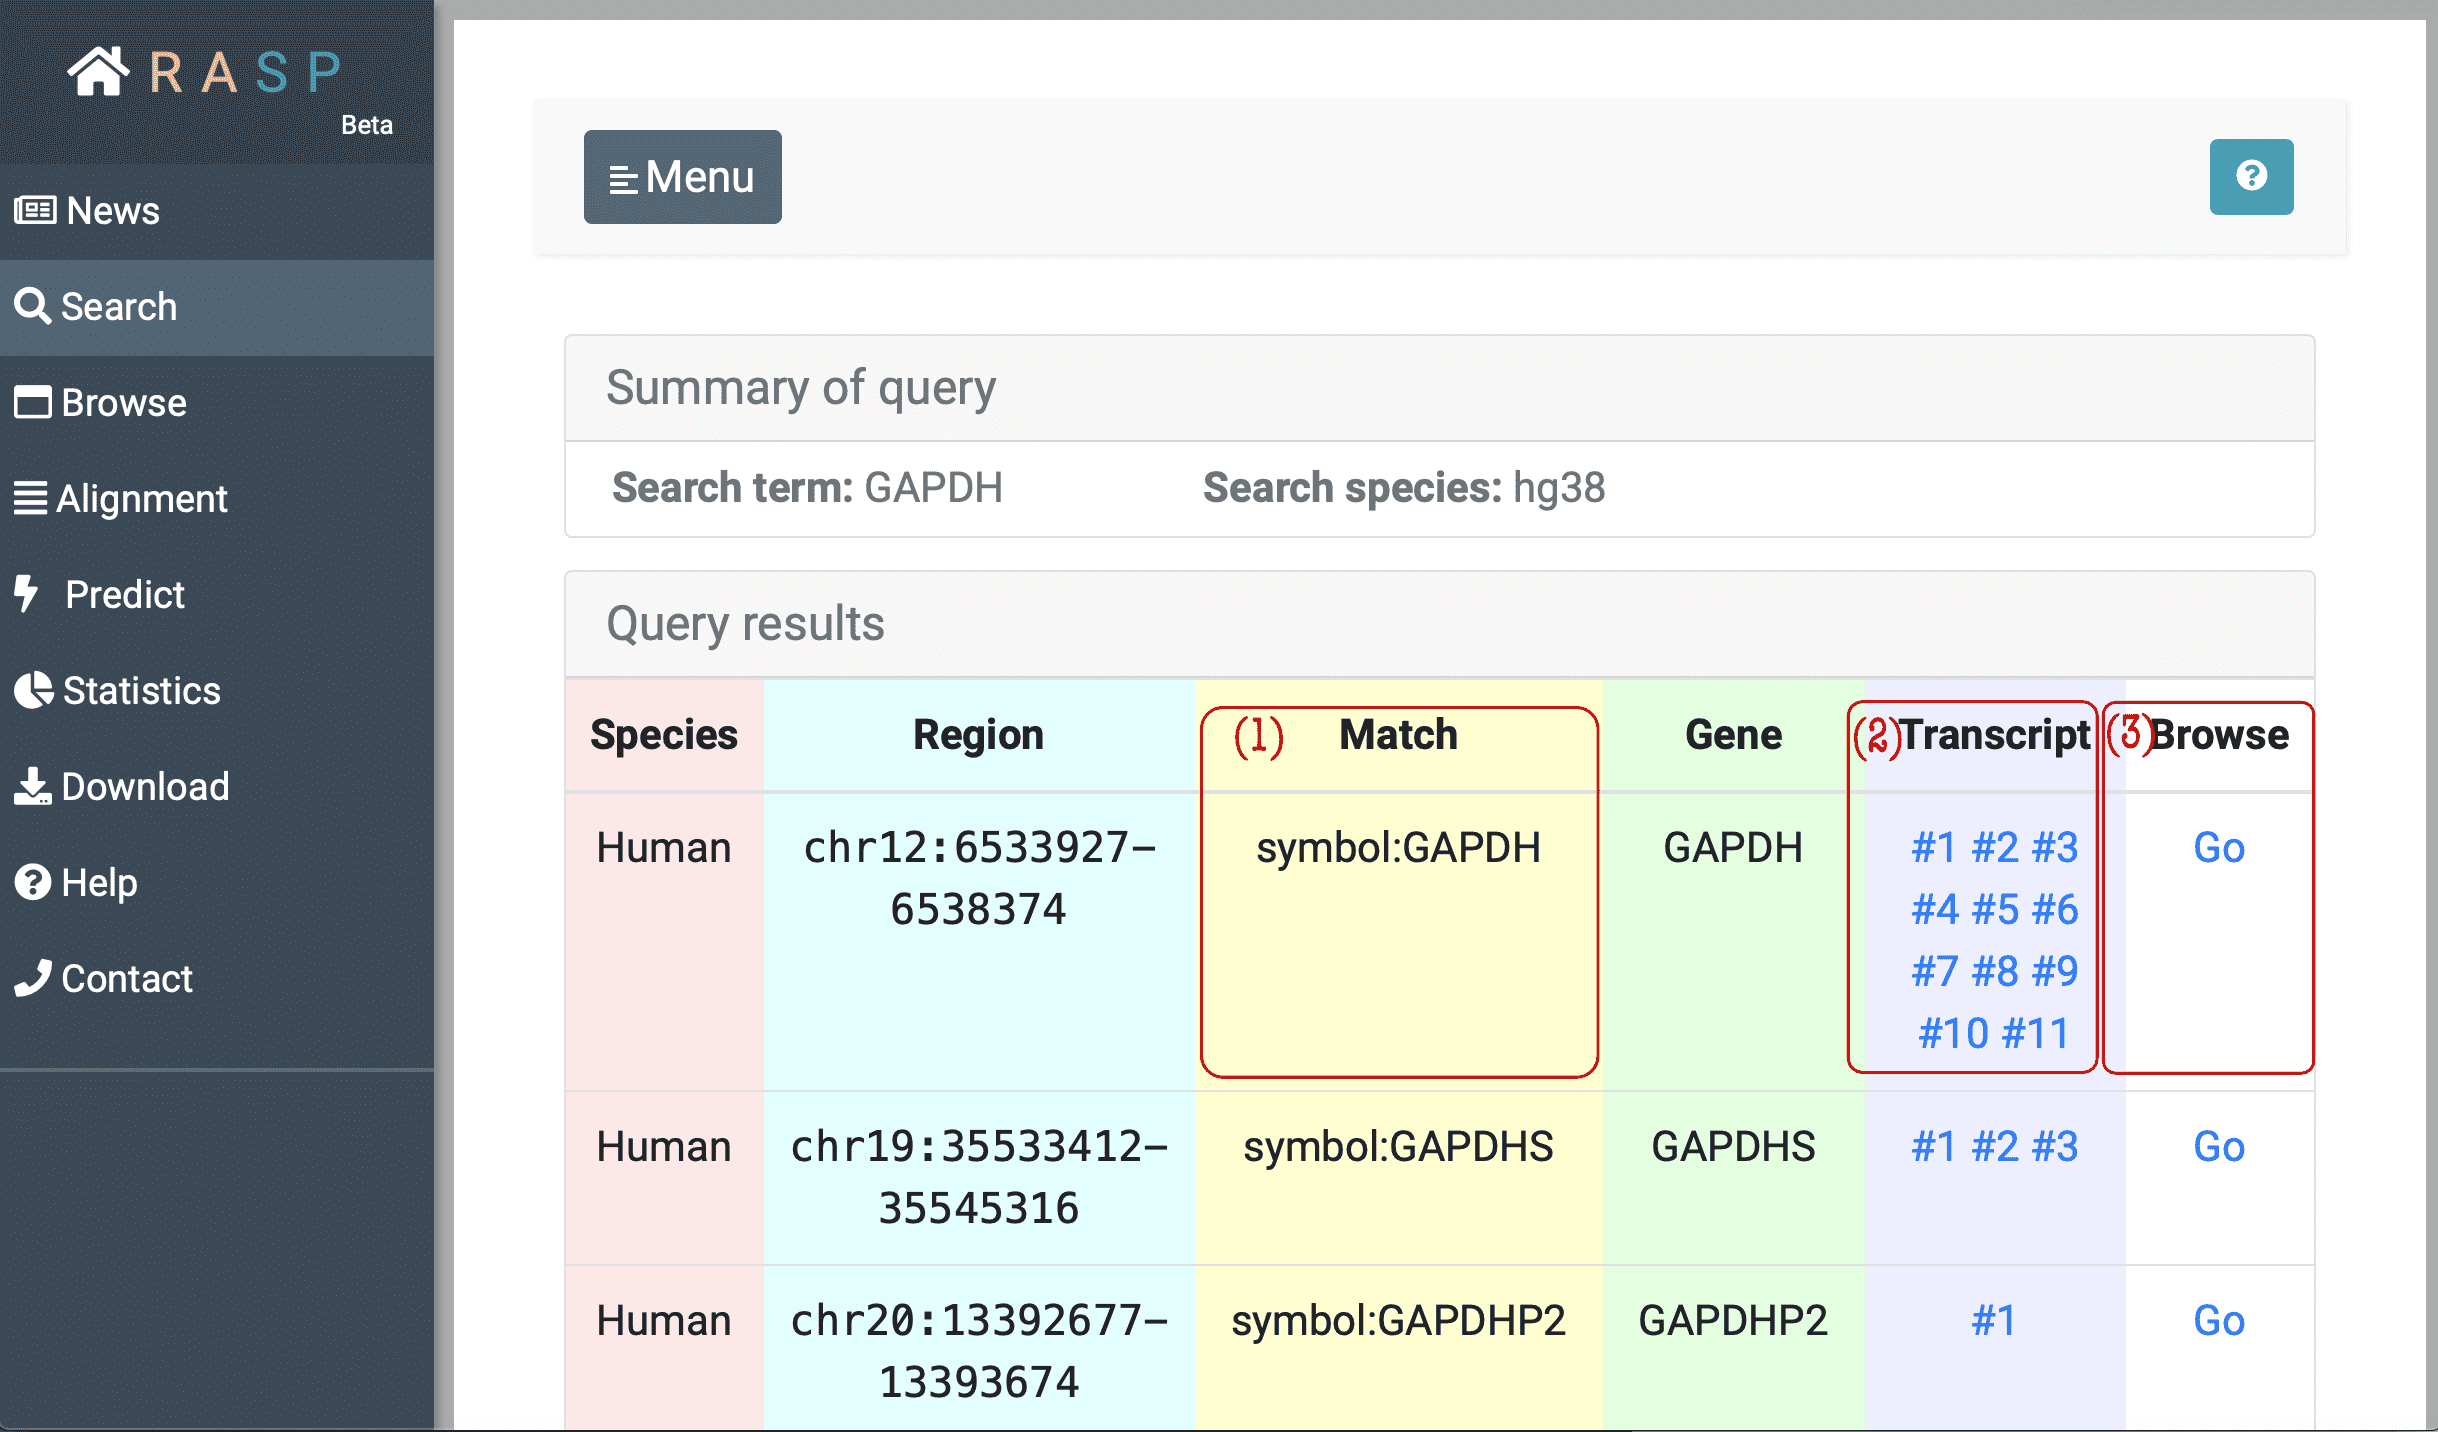
(1) Match: Matched gene symbol, gene ID or transcript ID.
(2) Transcript: Transcripts which overlap with this region. In the example window above, the transcript column of the first line means in this region, the gene has 11 isoforms. The "#1", "#2" buttons can be clicked and each corresponds to reactivity score from this chosen transcription point of view.
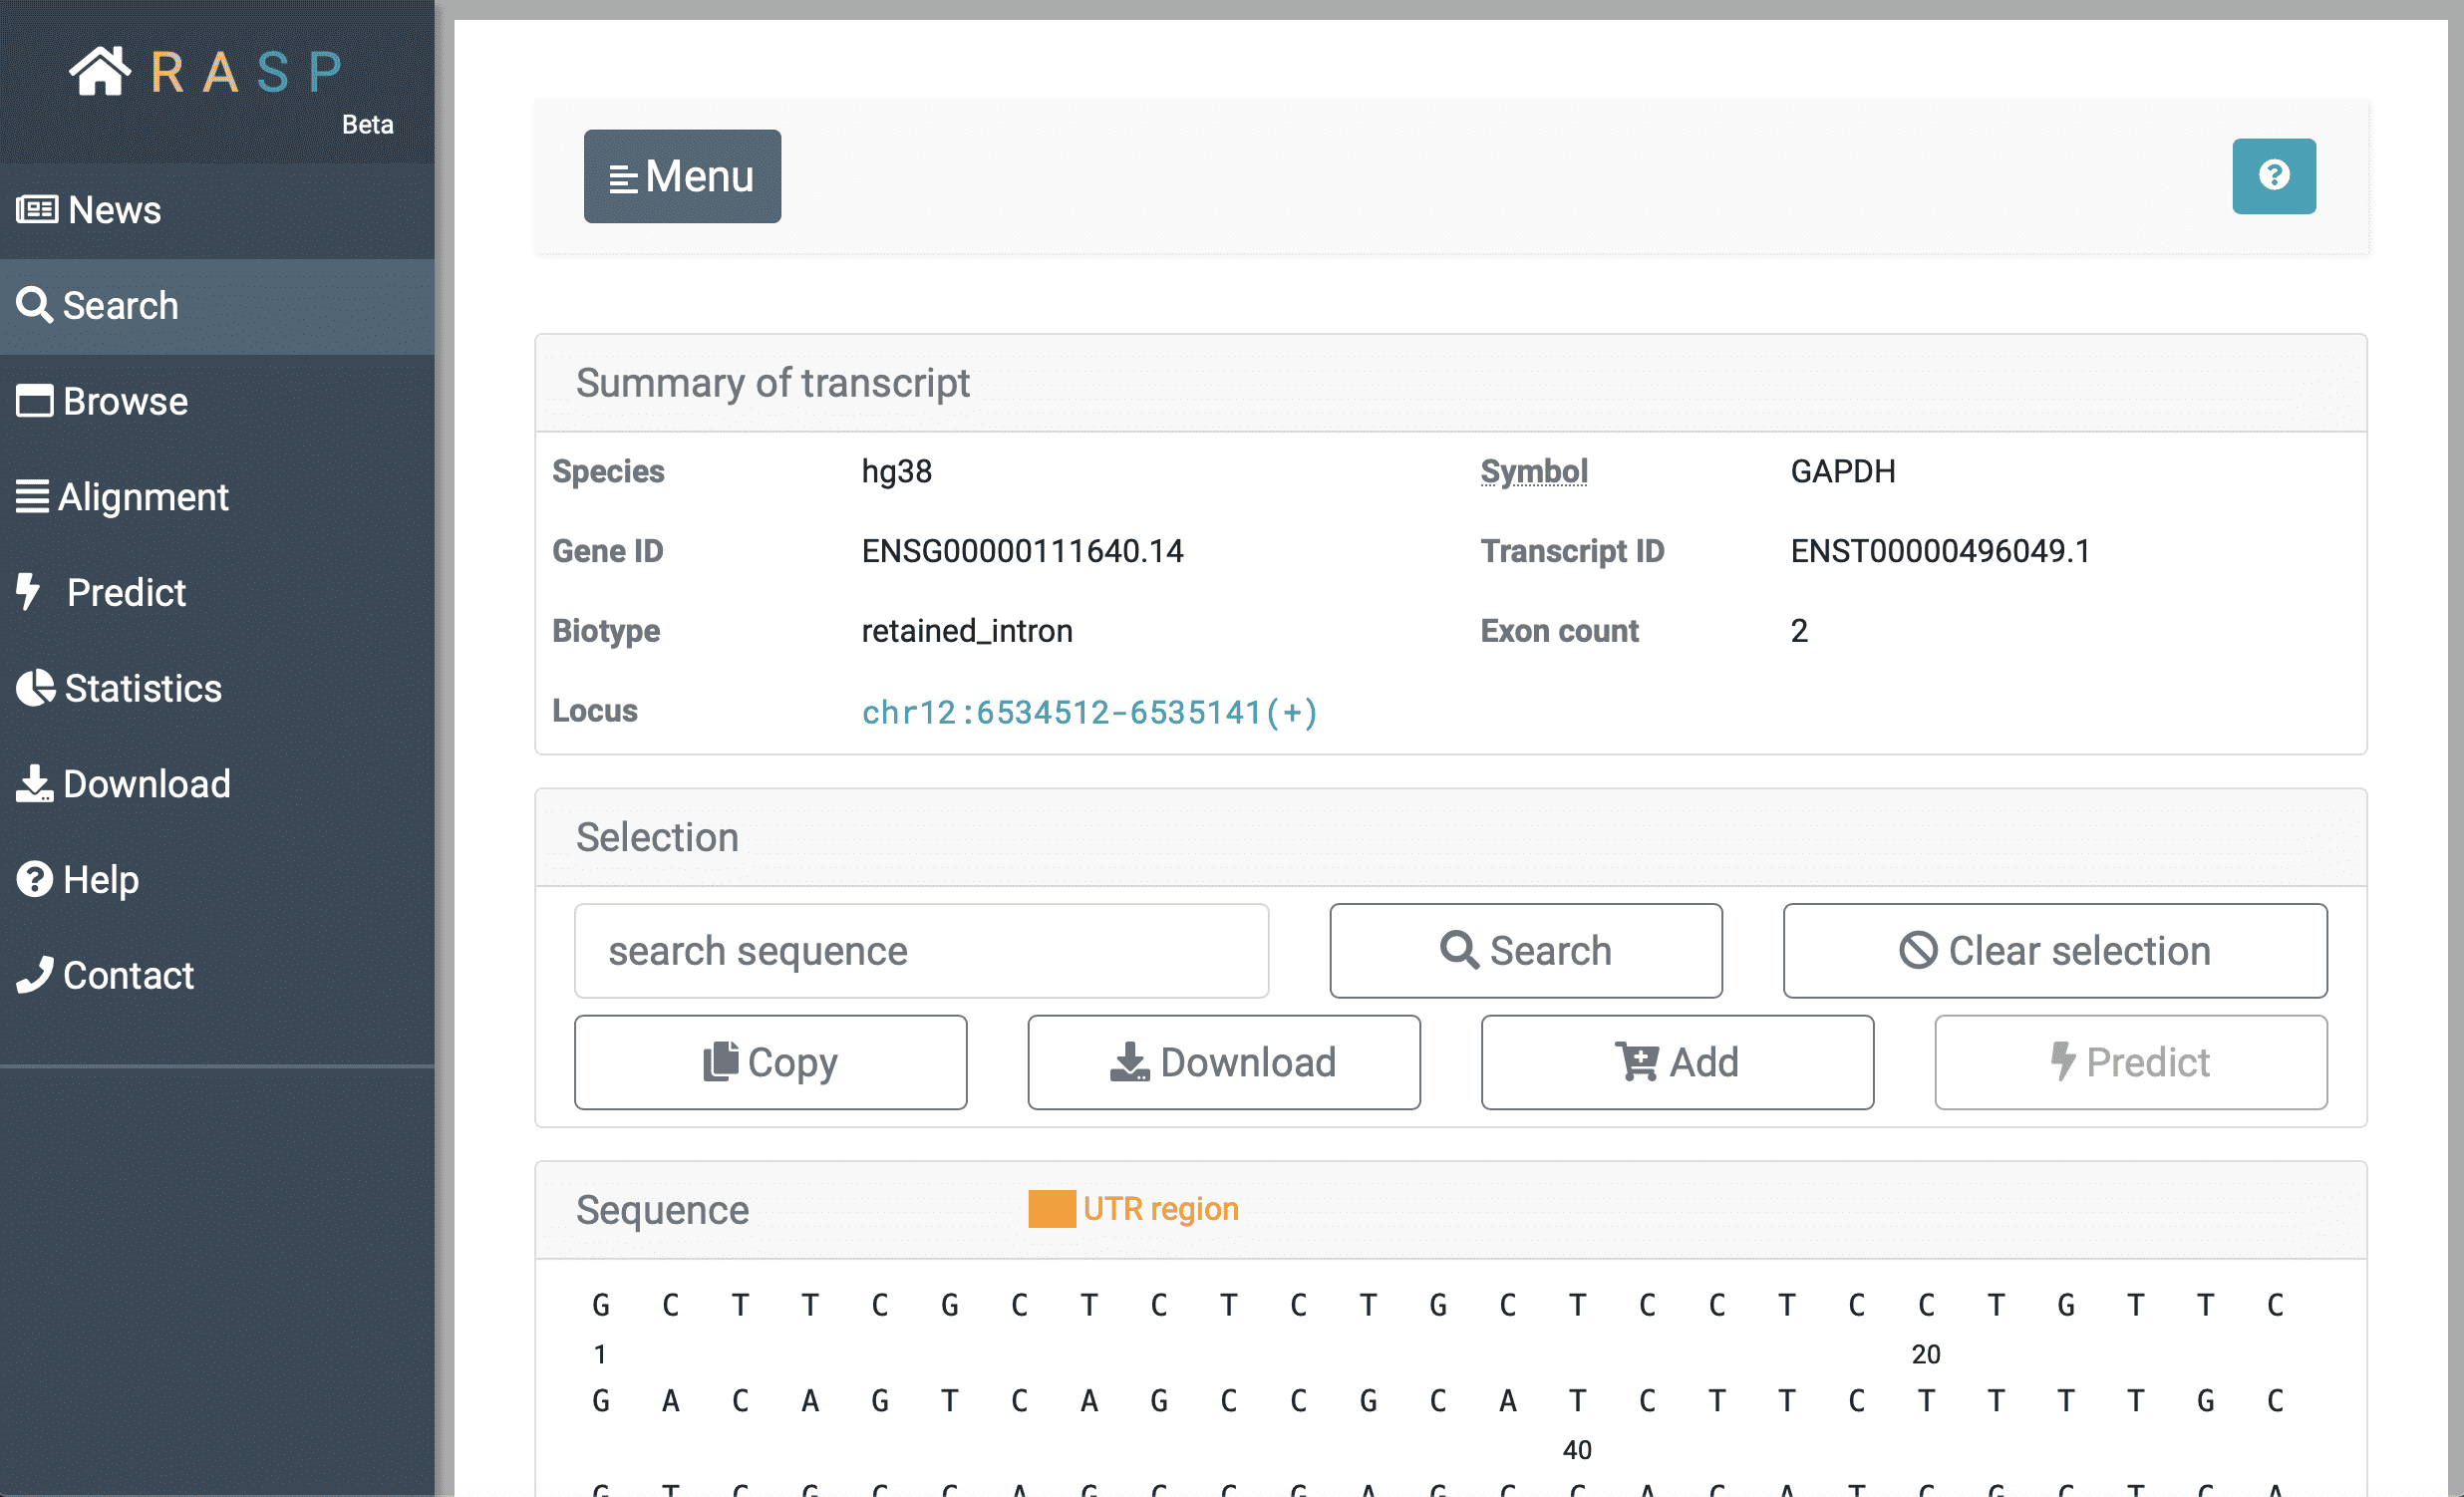
The following picture is what it looks like when chosen checking through Transcript, and in this situation transcript #2 of GAPDH gene is chosen . We'll talk in next chapter about how to view scores on this interface.
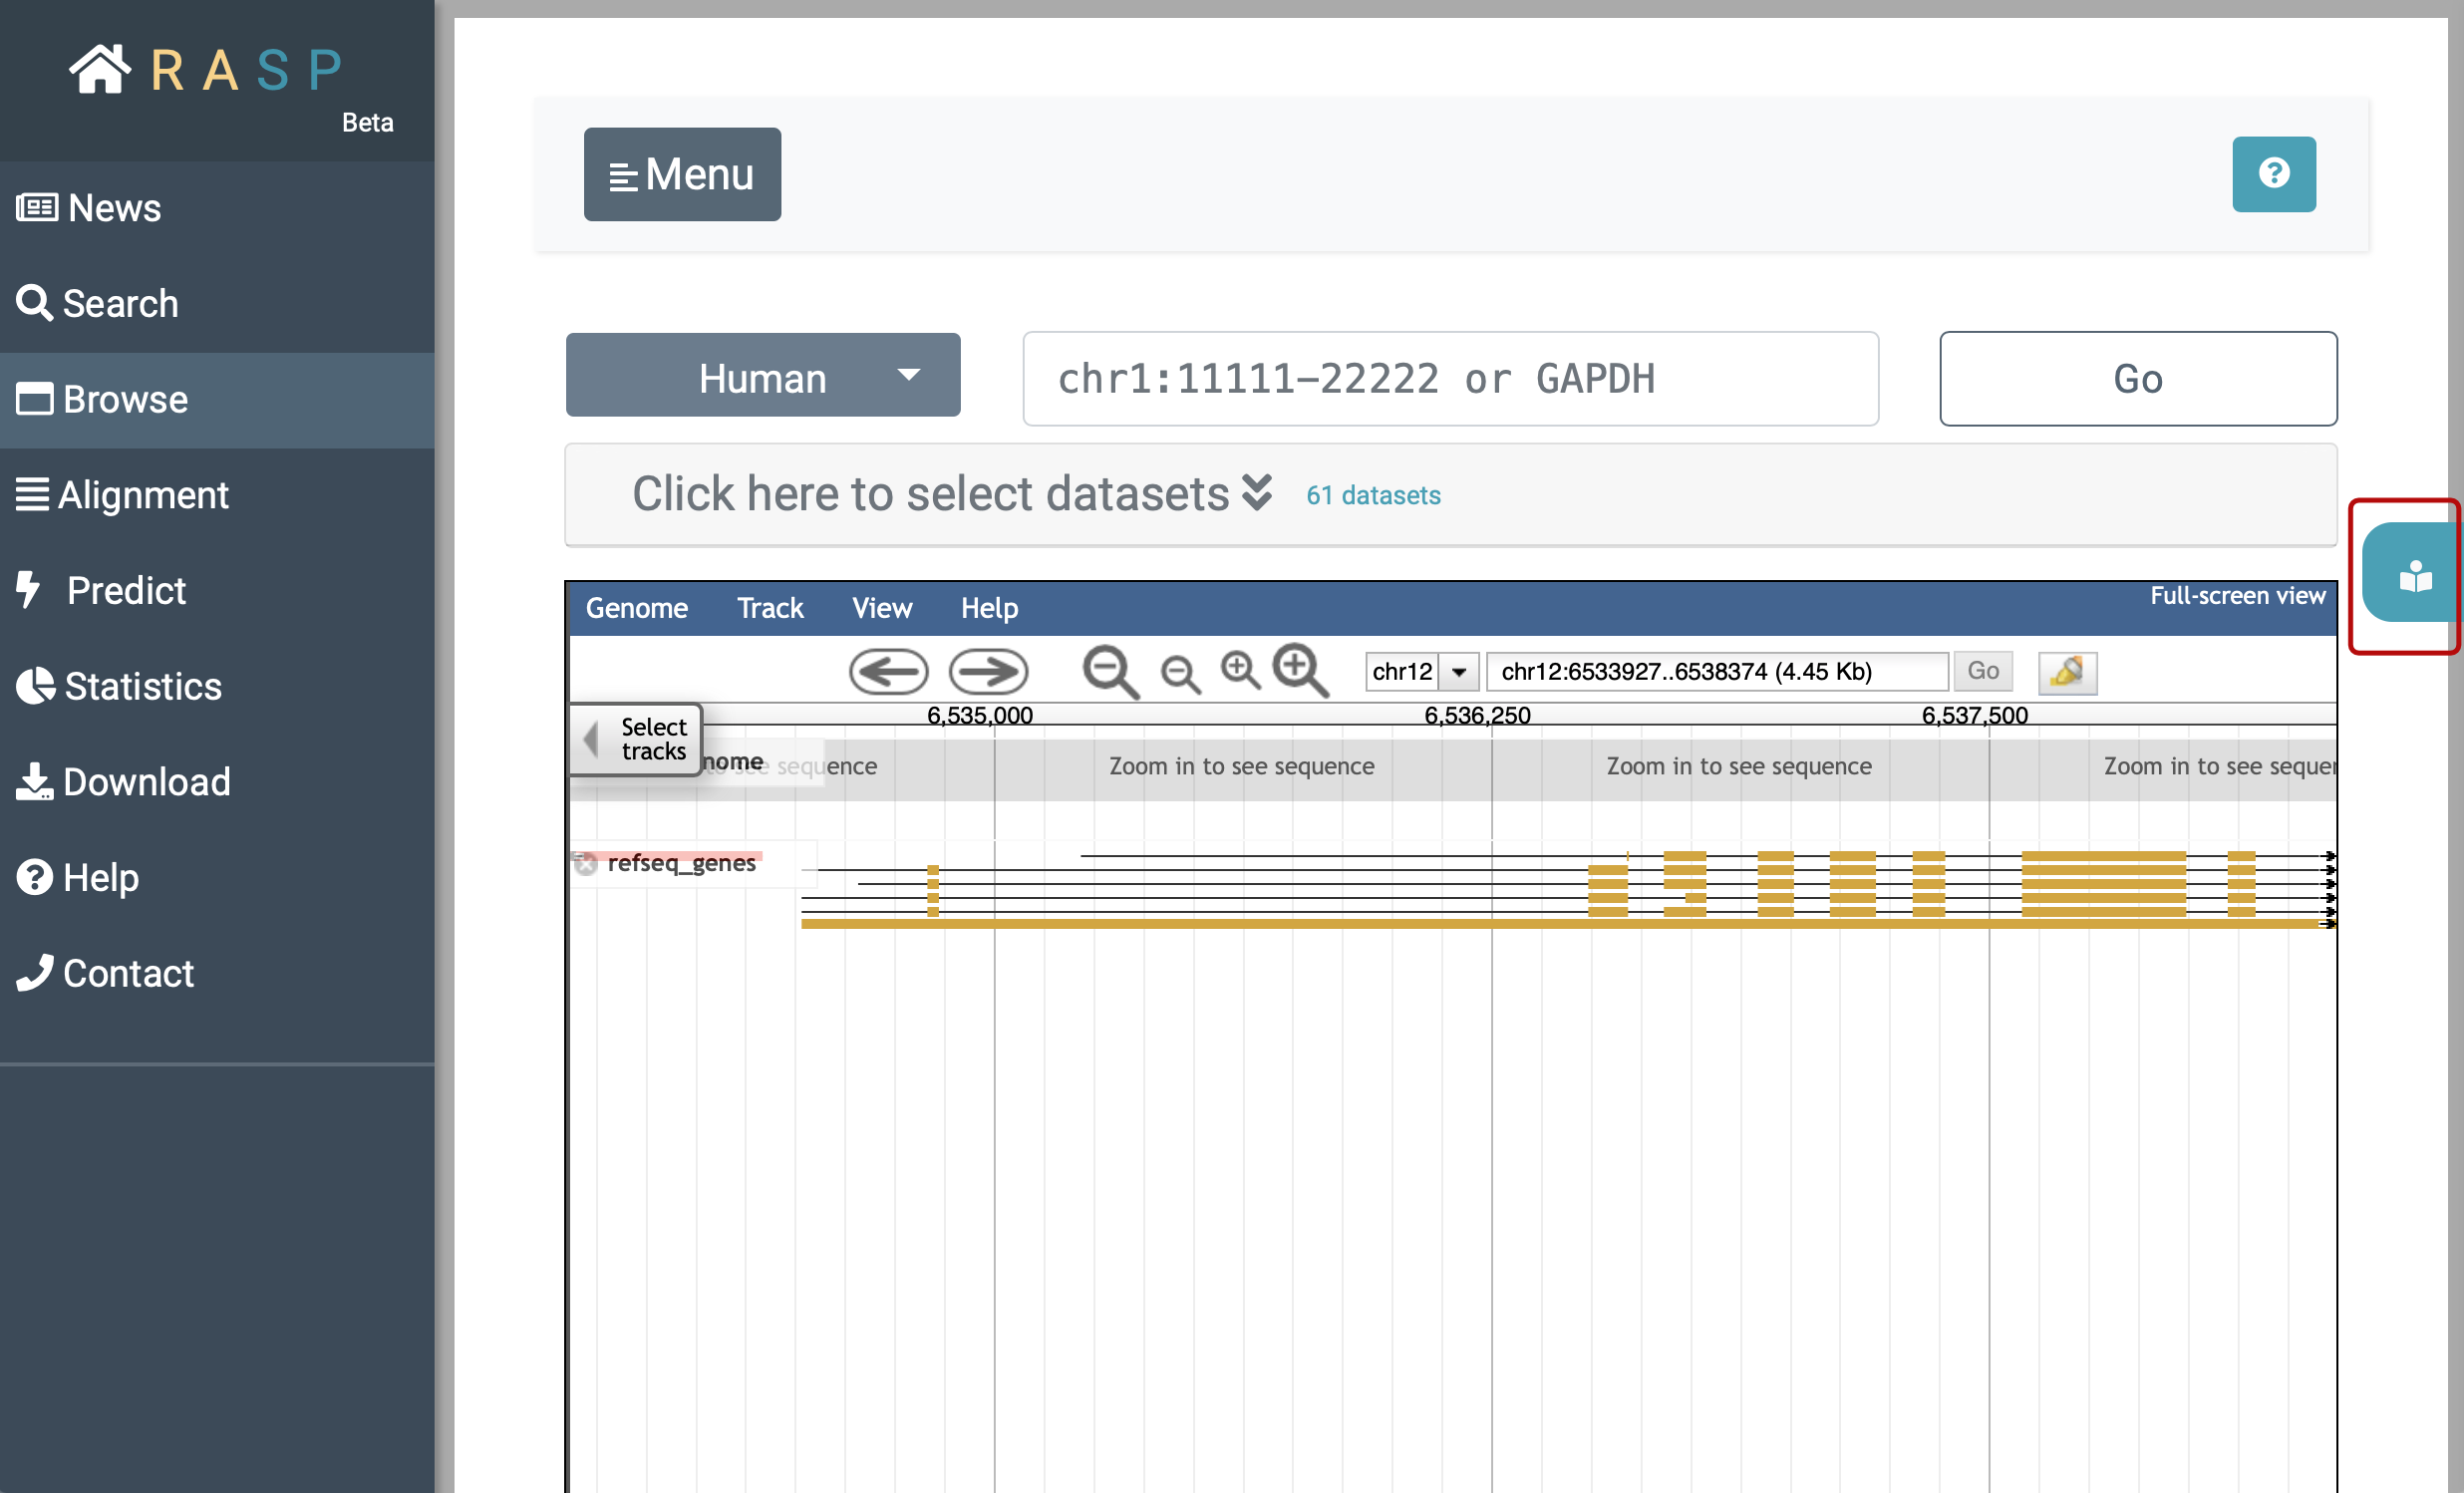
(3) Browse: Browse is designed to check the scores in genetic view. You could check what can be explored in this interface through clicking the botton circled red as shown in the following picture. Again, we'll come back to it on how to use this method.
2. How to look at scores through Transcript ?
In the last topic, we talked about the option of looking at scores from a transcript perspective, now we're going to look deeper, on how to view scores through "Transcript".

This is what looks like when choosing "Transcript". Except for the "Summary of transcript", if you slide it down you could see other colunms under.

For instance, we select 'HEK293T_invivo' sample from article 'Lu et al., Cell, 2016', and the information about the data is as shown above. Move to "Sequence", where different points have been color-coded for each base. There are two ways to choose a certain region to check scores. You could ① input the exact base sequence of interest and click ② "Search" or you could as well directly select the start and then the end of the sequence that you want to search for. After you have clicked the end base, the sequence between the first and last bases (including the first and last bases) is selected.
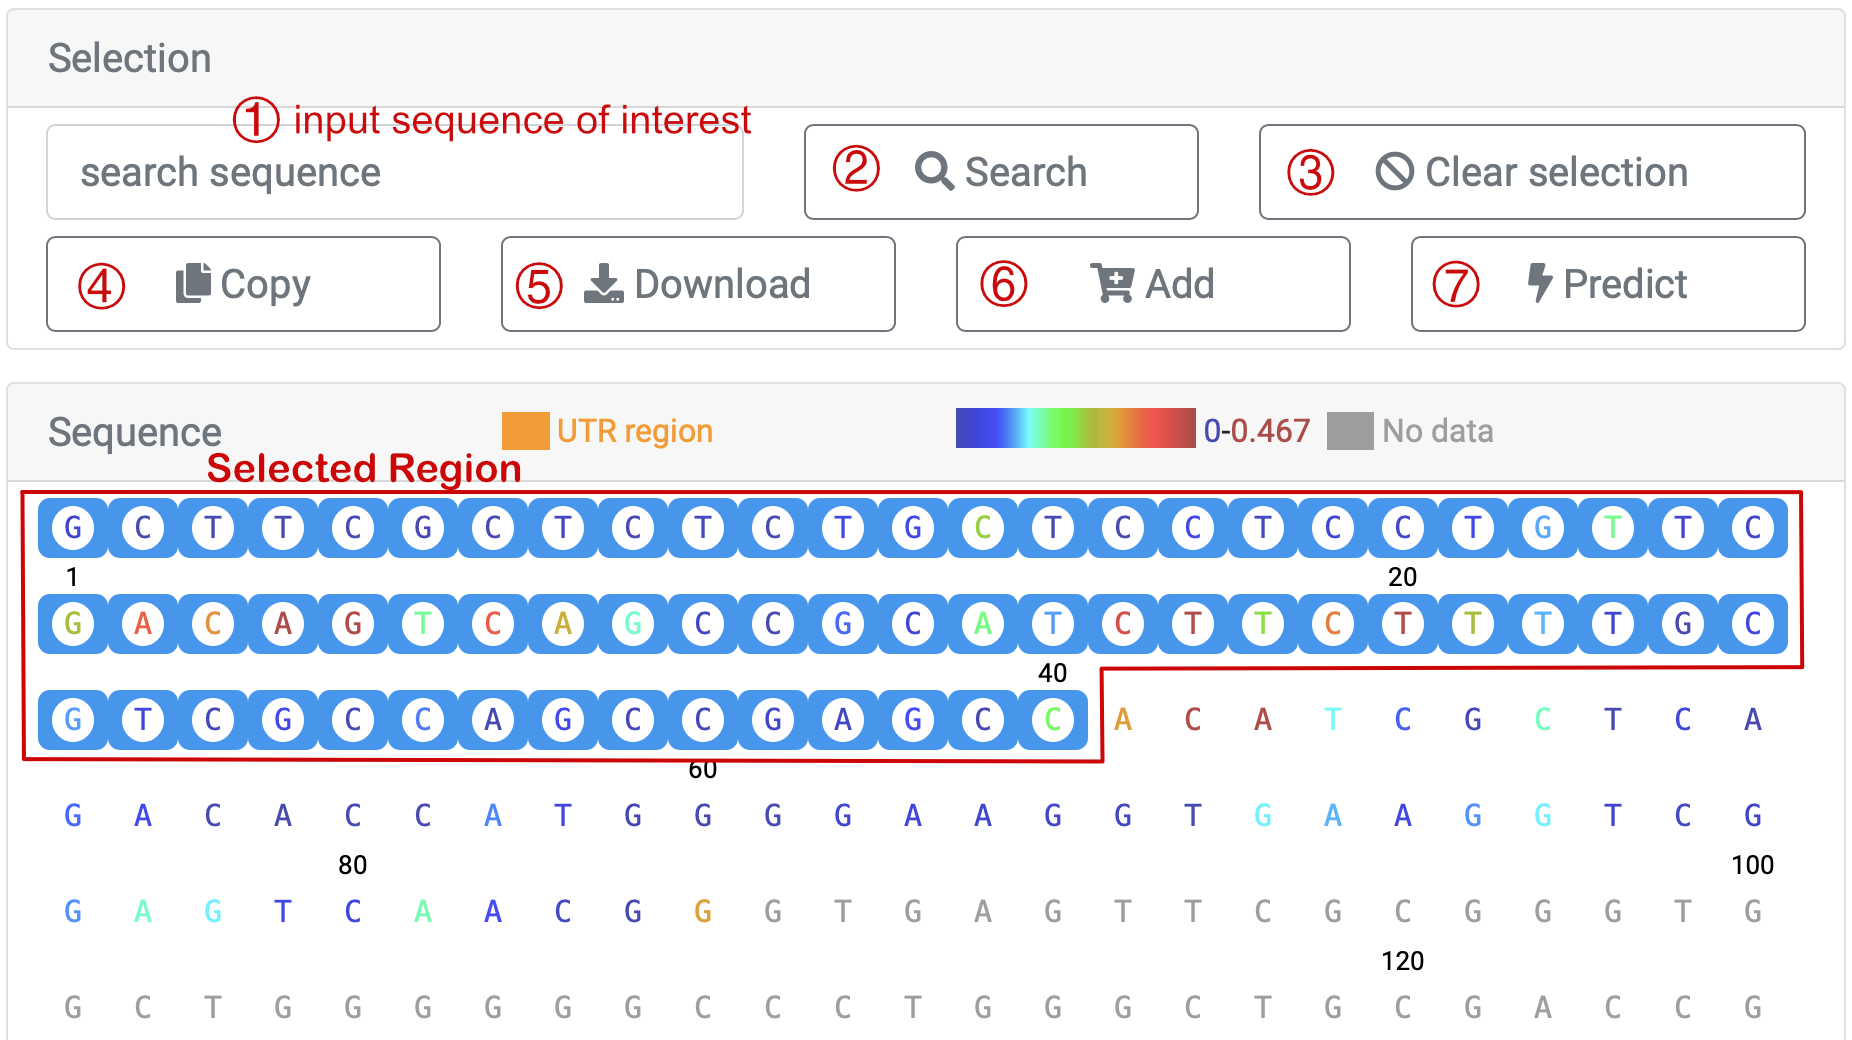
You could click ④ ' ' to copy the sequence you've selected, and data download, which includes base sequence and corresponding scores, is also provided as you click ⑤ '
 '. If you want to select another region, ③ '
 ' is what you need to press first.
For instance, we first choose 1-50 bases and name this region 'selected_1-50', and we click "Add". After this, you could see  in the menu bar on the left. It means the sequence and the scores of the chosen region are added in Alignment interface. Next, we "Clear Selection" to choose 51-100 bases and name it 'selected_51-100' and add to alignment.
Below is how the steps are taken. As for the results part, we normally compare two or three related regions but not such randomly chosen ones. The "Alignment" tries to find the maximum alignment method, and the bases that cannot be aligned are represented by gray blocks, and for the matched bases with higher value comes higher square column. In addition, the original comparison sequences and values support download as you press the "Download" button.

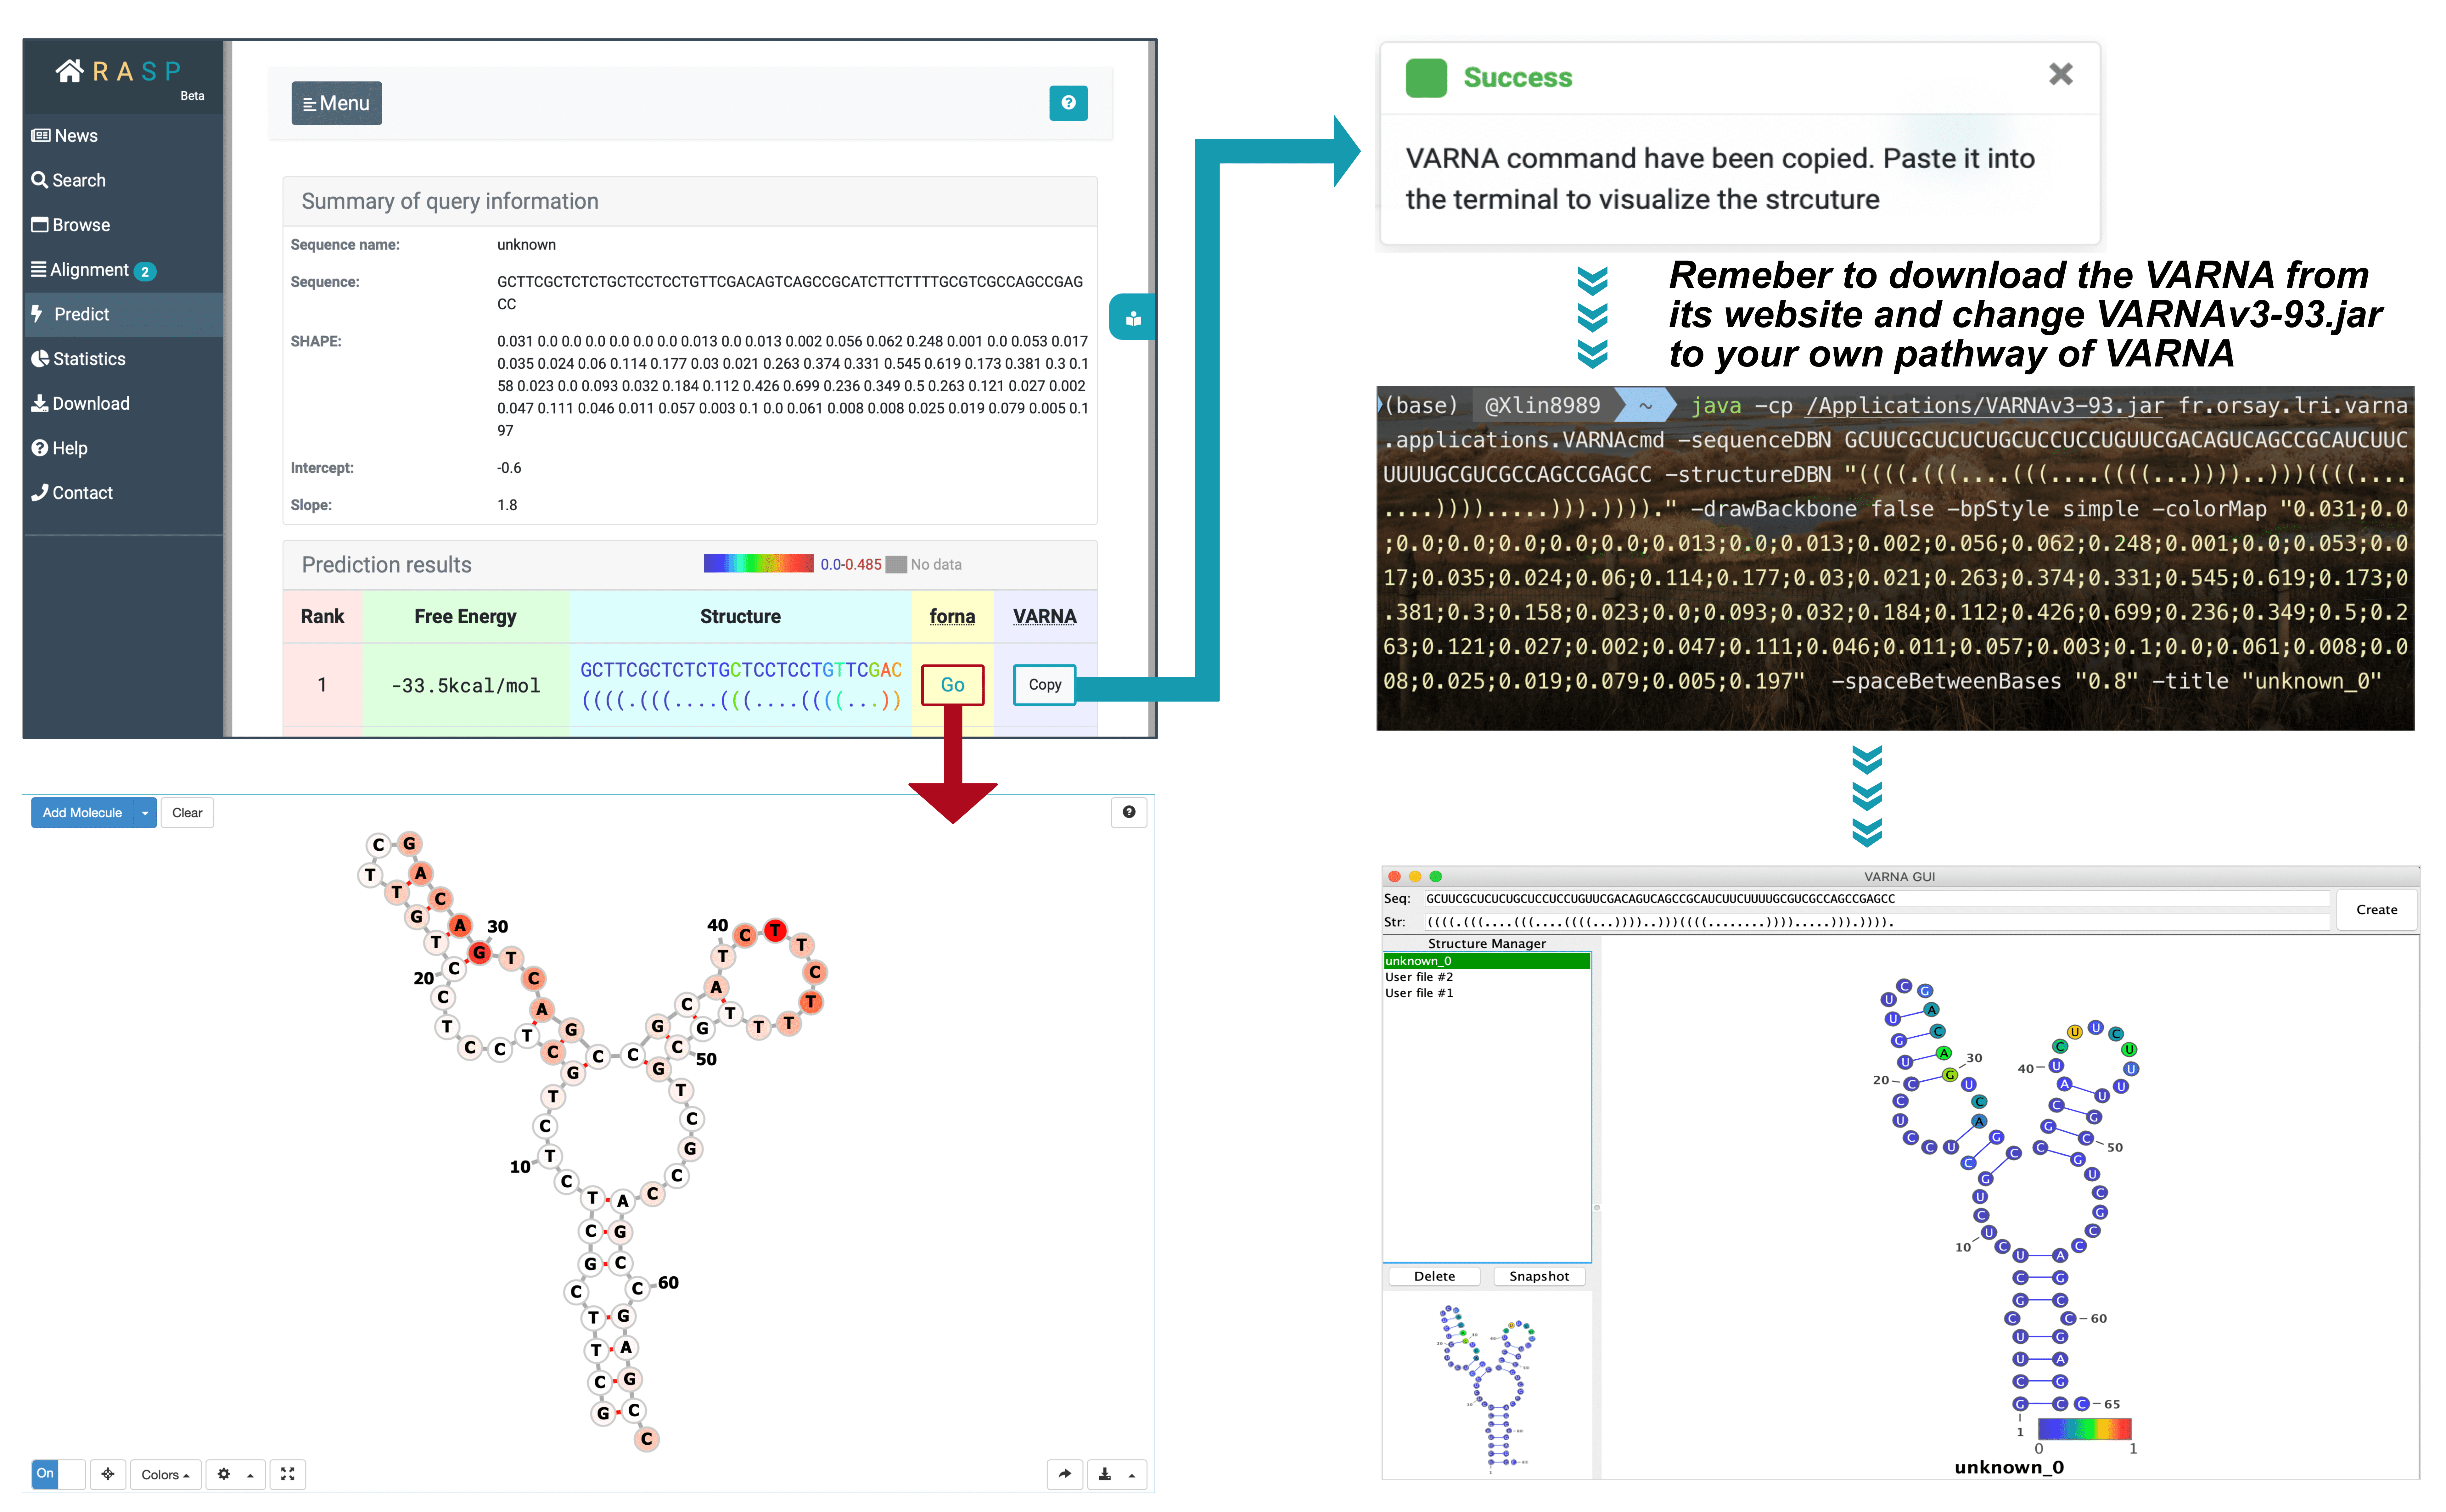
After sequence selected, press "Predict", a new window with sequence and scores will be open. Set the Intercept and Slop value, and then you could submit the data and get the predicted RNA secondary structure.
|
Note: The botton "Predict" won't work if you haven't selected any sequence region. |
As shown, there are two methods provided, one is through forna, another is VARNA. The method, forna, is simple, and a direct click brings up a window displaying the secondary structure of RNA. But for VARNA, it takes a bit more steps as you need to first download it from http://varna.lri.fr/index.php?lang=en&page=downloads&css=varna , and record its pathway on you computer.
After downloads and copying, you may get this on your clipboard:
|
java -cp VARNAv3-93.jar fr.orsay.lri.varna.applications.VARNAcmd -sequenceDBN GCUUCGCUCUCUGCUCCUCCUGUUCGACAGUCAGCCGCAUCUUCUUUUGCGUCGCCAGCCGAGCC -structureDBN "((((.(((....(((....((((...))))..)))((((........)))).....))).))))." -drawBackbone false -bpStyle simple -colorMap "0.031;0.0;0.0;0.0;0.0;0.0;0.0;0.013;0.0;0.013;0.002;0.056;0.062;0.248;0.001;0.0;0.053;0.017;0.035;0.024;0.06;0.114;0.177;0.03;0.021;0.263;0.374;0.331;0.545;0.619;0.173;0.381;0.3;0.158;0.023;0.0;0.093;0.032;0.184;0.112;0.426;0.699;0.236;0.349;0.5;0.263;0.121;0.027;0.002;0.047;0.111;0.046;0.011;0.057;0.003;0.1;0.0;0.061;0.008;0.008;0.025;0.019;0.079;0.005;0.197" -spaceBetweenBases "0.8" -title "unknown_0" |
Open your terminal and copy this contents on the clipboard, in the meanwhile change VARNAv3-93.jar to your own pathway of this VARNAv3-93.jar. Click on ENTER and you will get the result.
3. How to use Browse ?
Now we're back on Browse:
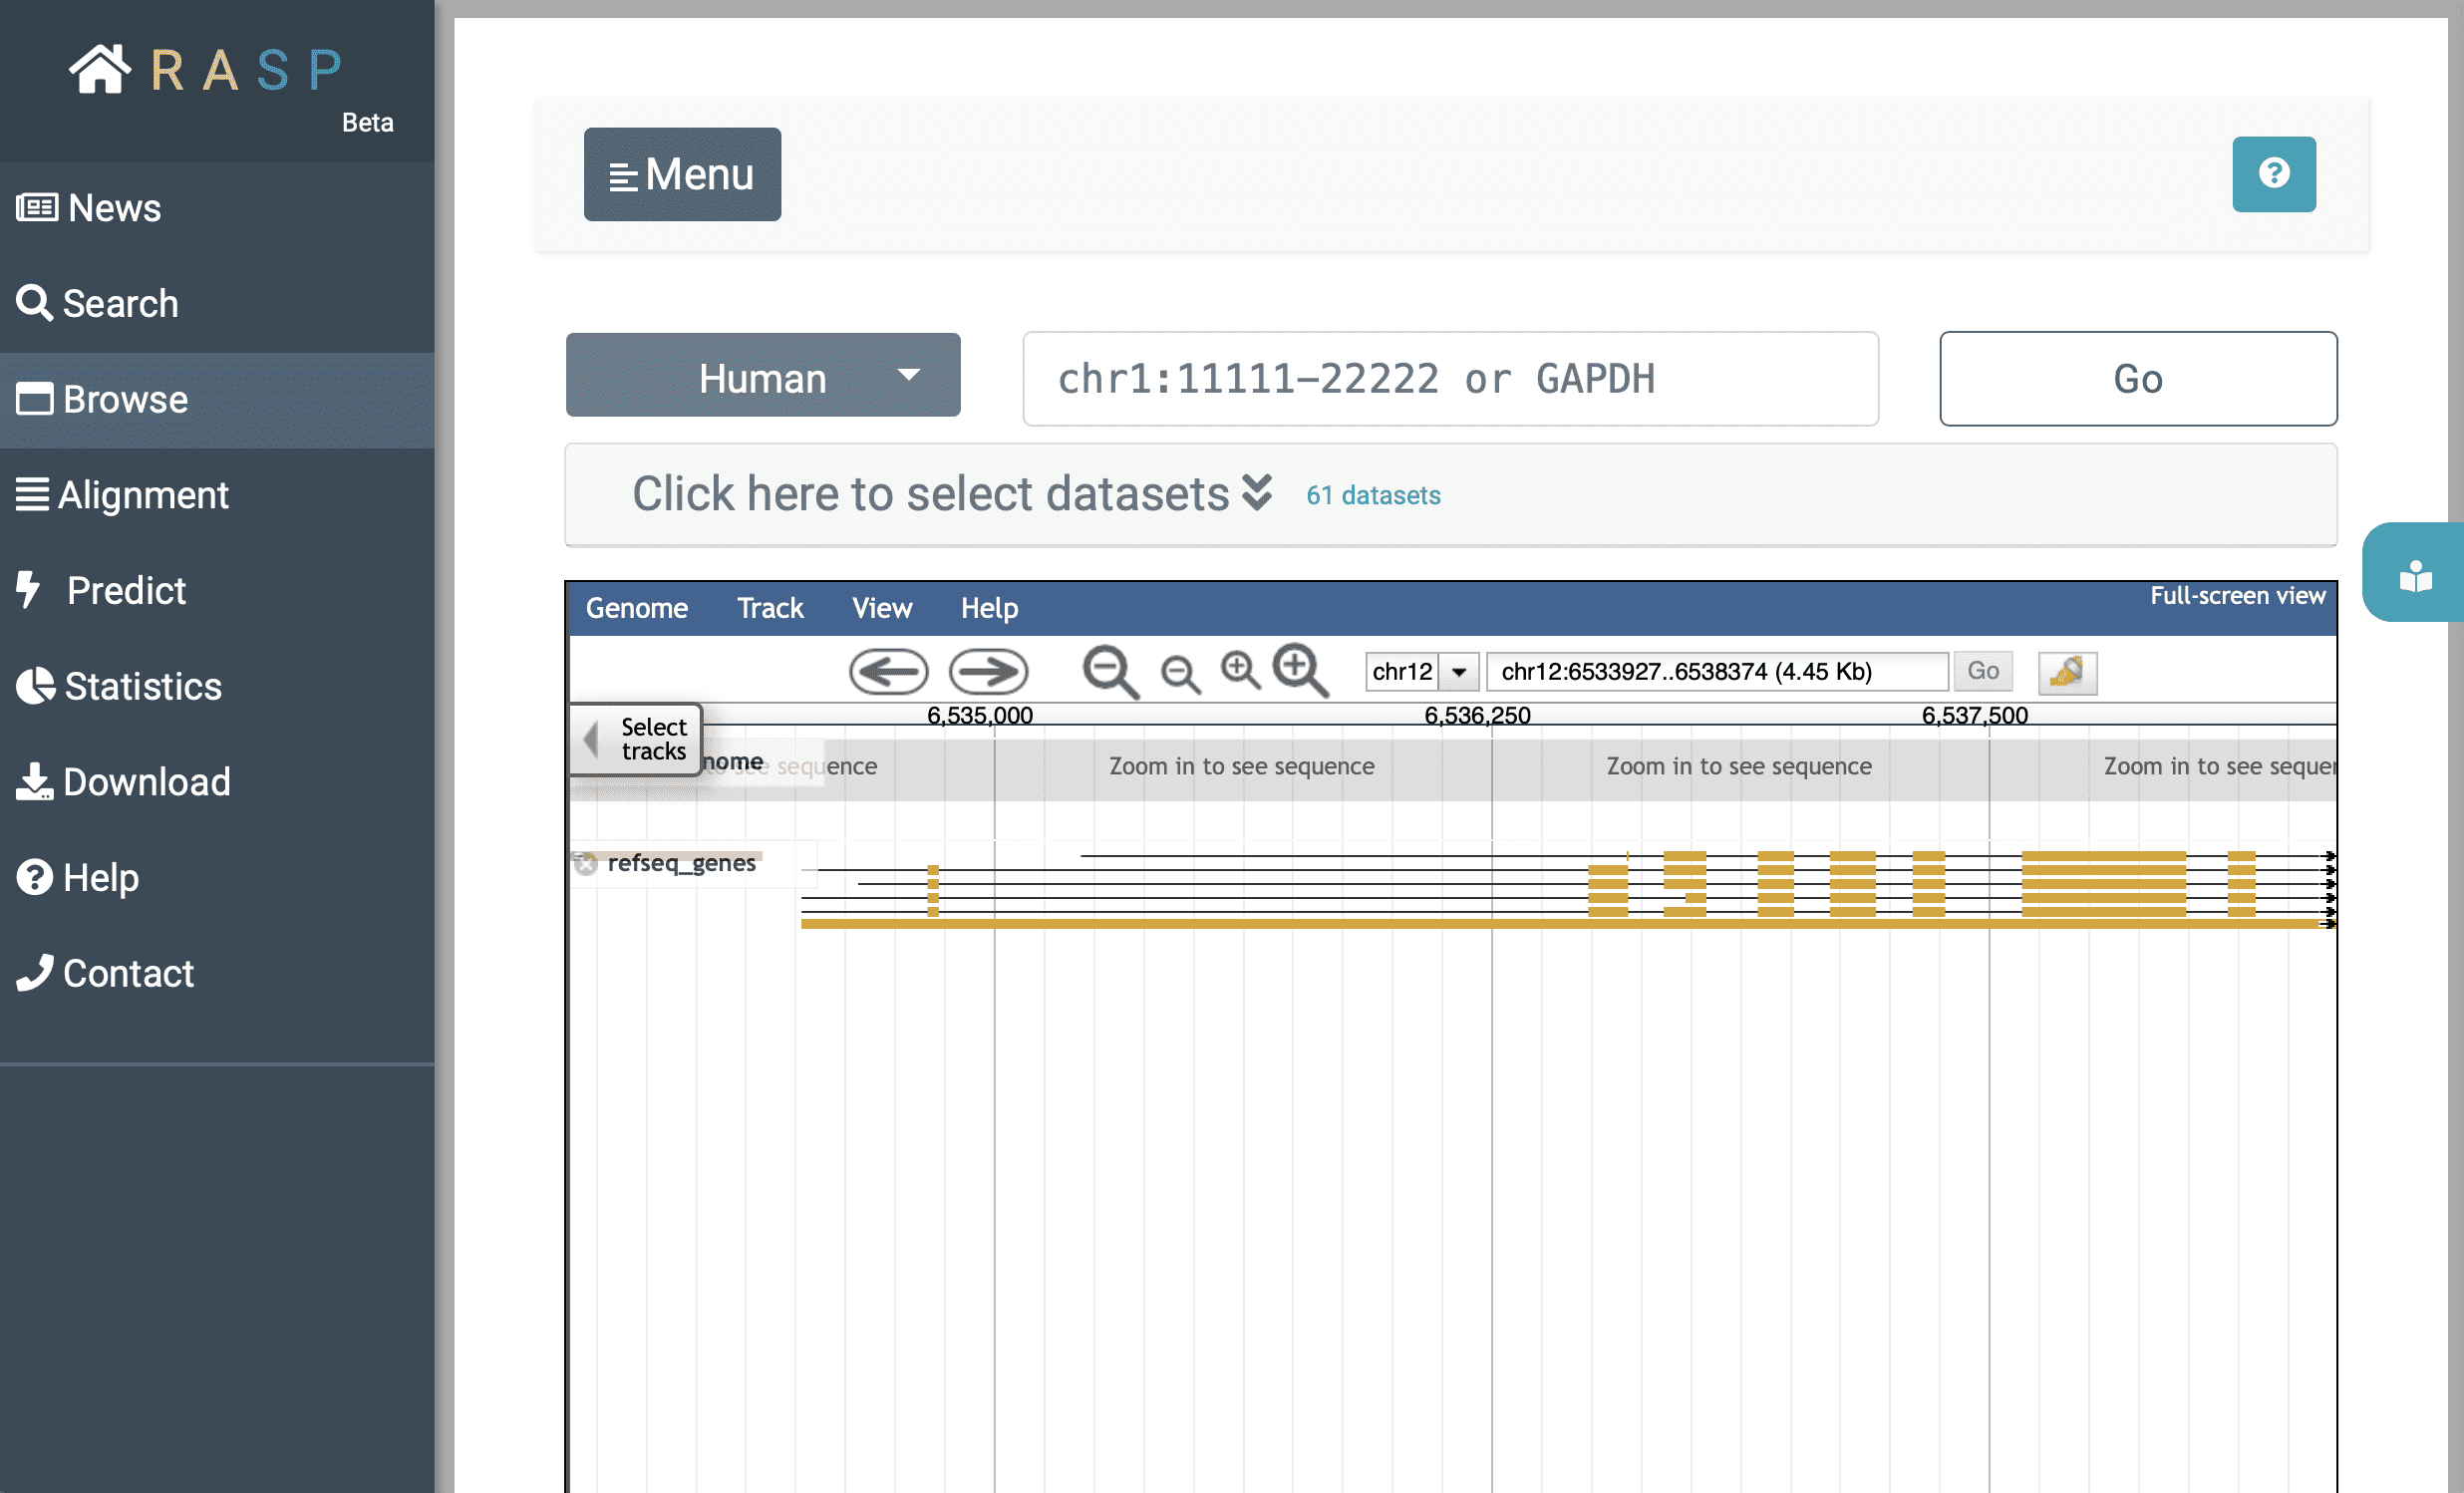
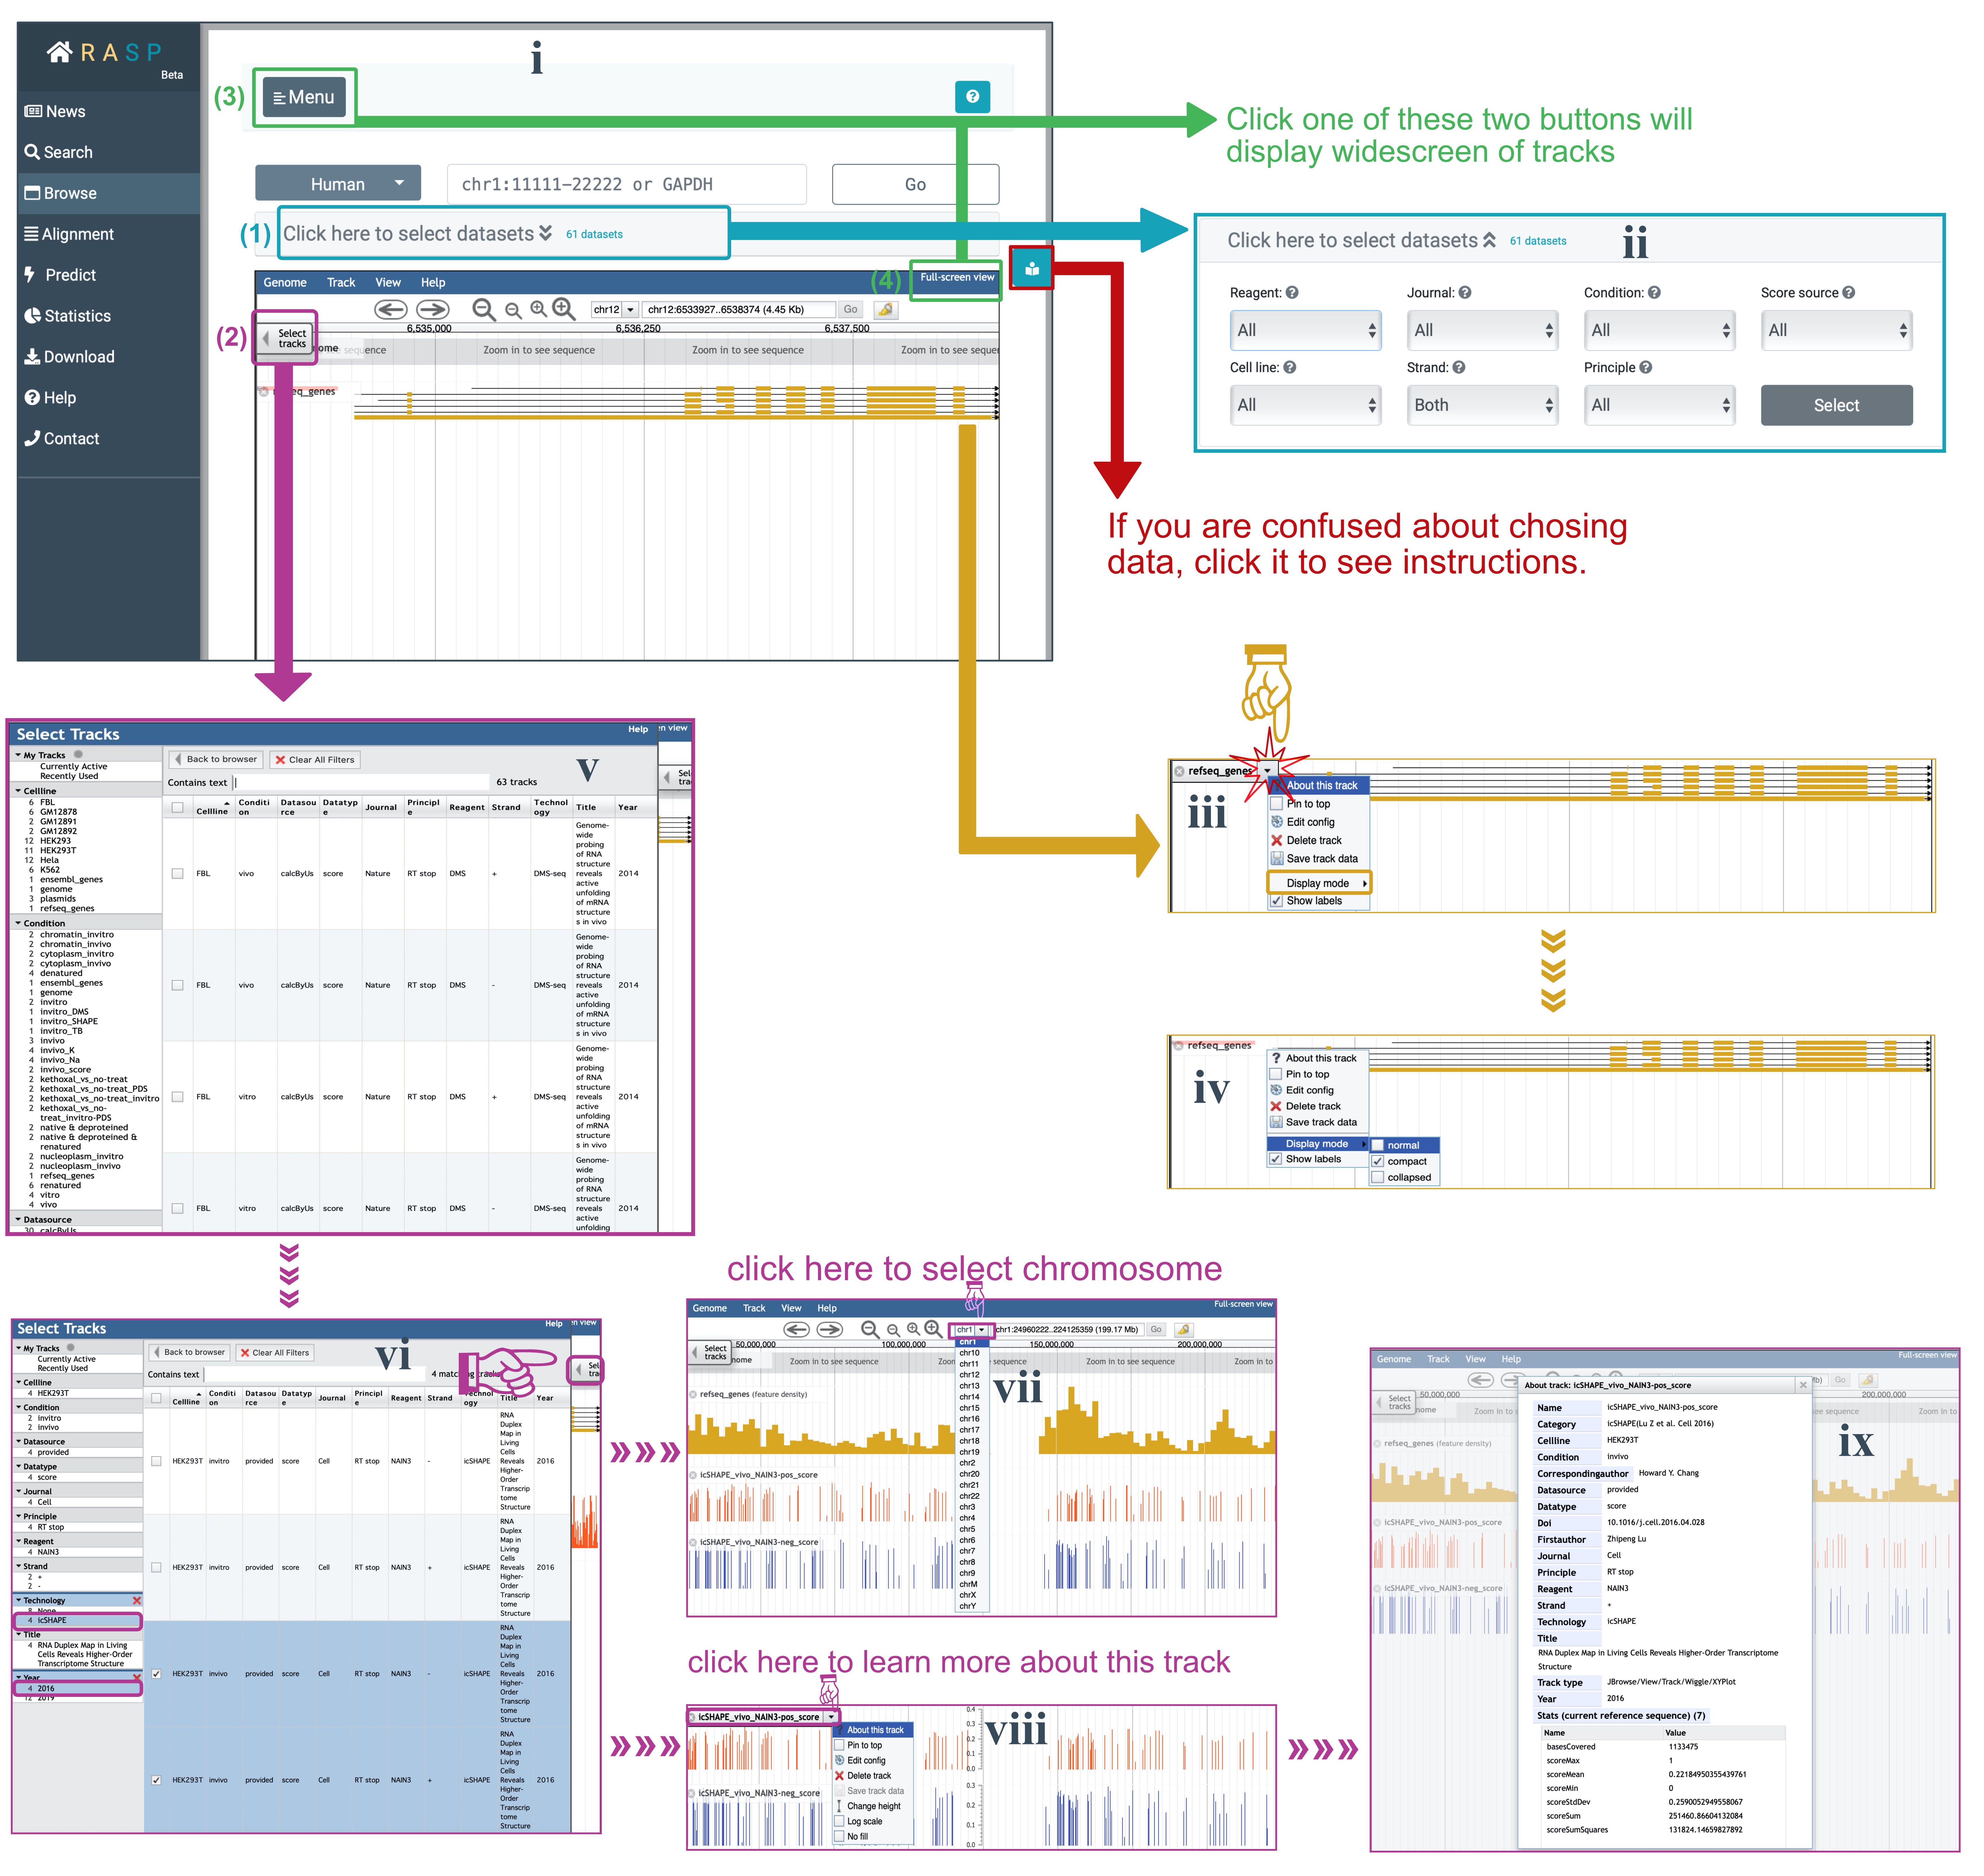
After decided which organism to use (in this example we choose 'Human'), you could either expand (1)  to select data through setting Reagent, Journal, Condition, and other information, or you could jump to track selection window by clicking (2)
  .
.
In the initial interface, the track of the species gene and annotation information is displayed by default. Click the ' ▾ ' in  , as in subgraph iii, you could see here are several options.
For Select Tracks, here for example in subimage vi, we select 'icSHAPE' in the Technology column and '2016' in the Year column in the left menu bar 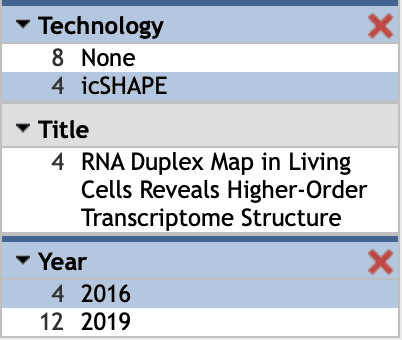 , and then four datasets are shown. Next, select 'invivo' data and then click '
 .' to hide selection window, the selected two tracks are now displayed.
If you want to choose different chromosomes, set  as subgraph vii. What's more, for a specific track, as shown in viii, you could click the ' ▾ ' button to see more information about this data, you could also click '
 ' to set the track scale to your preference. Figure ix shows what information is given when you check 'About this track'.
4. How to use Alignment & Predict ?
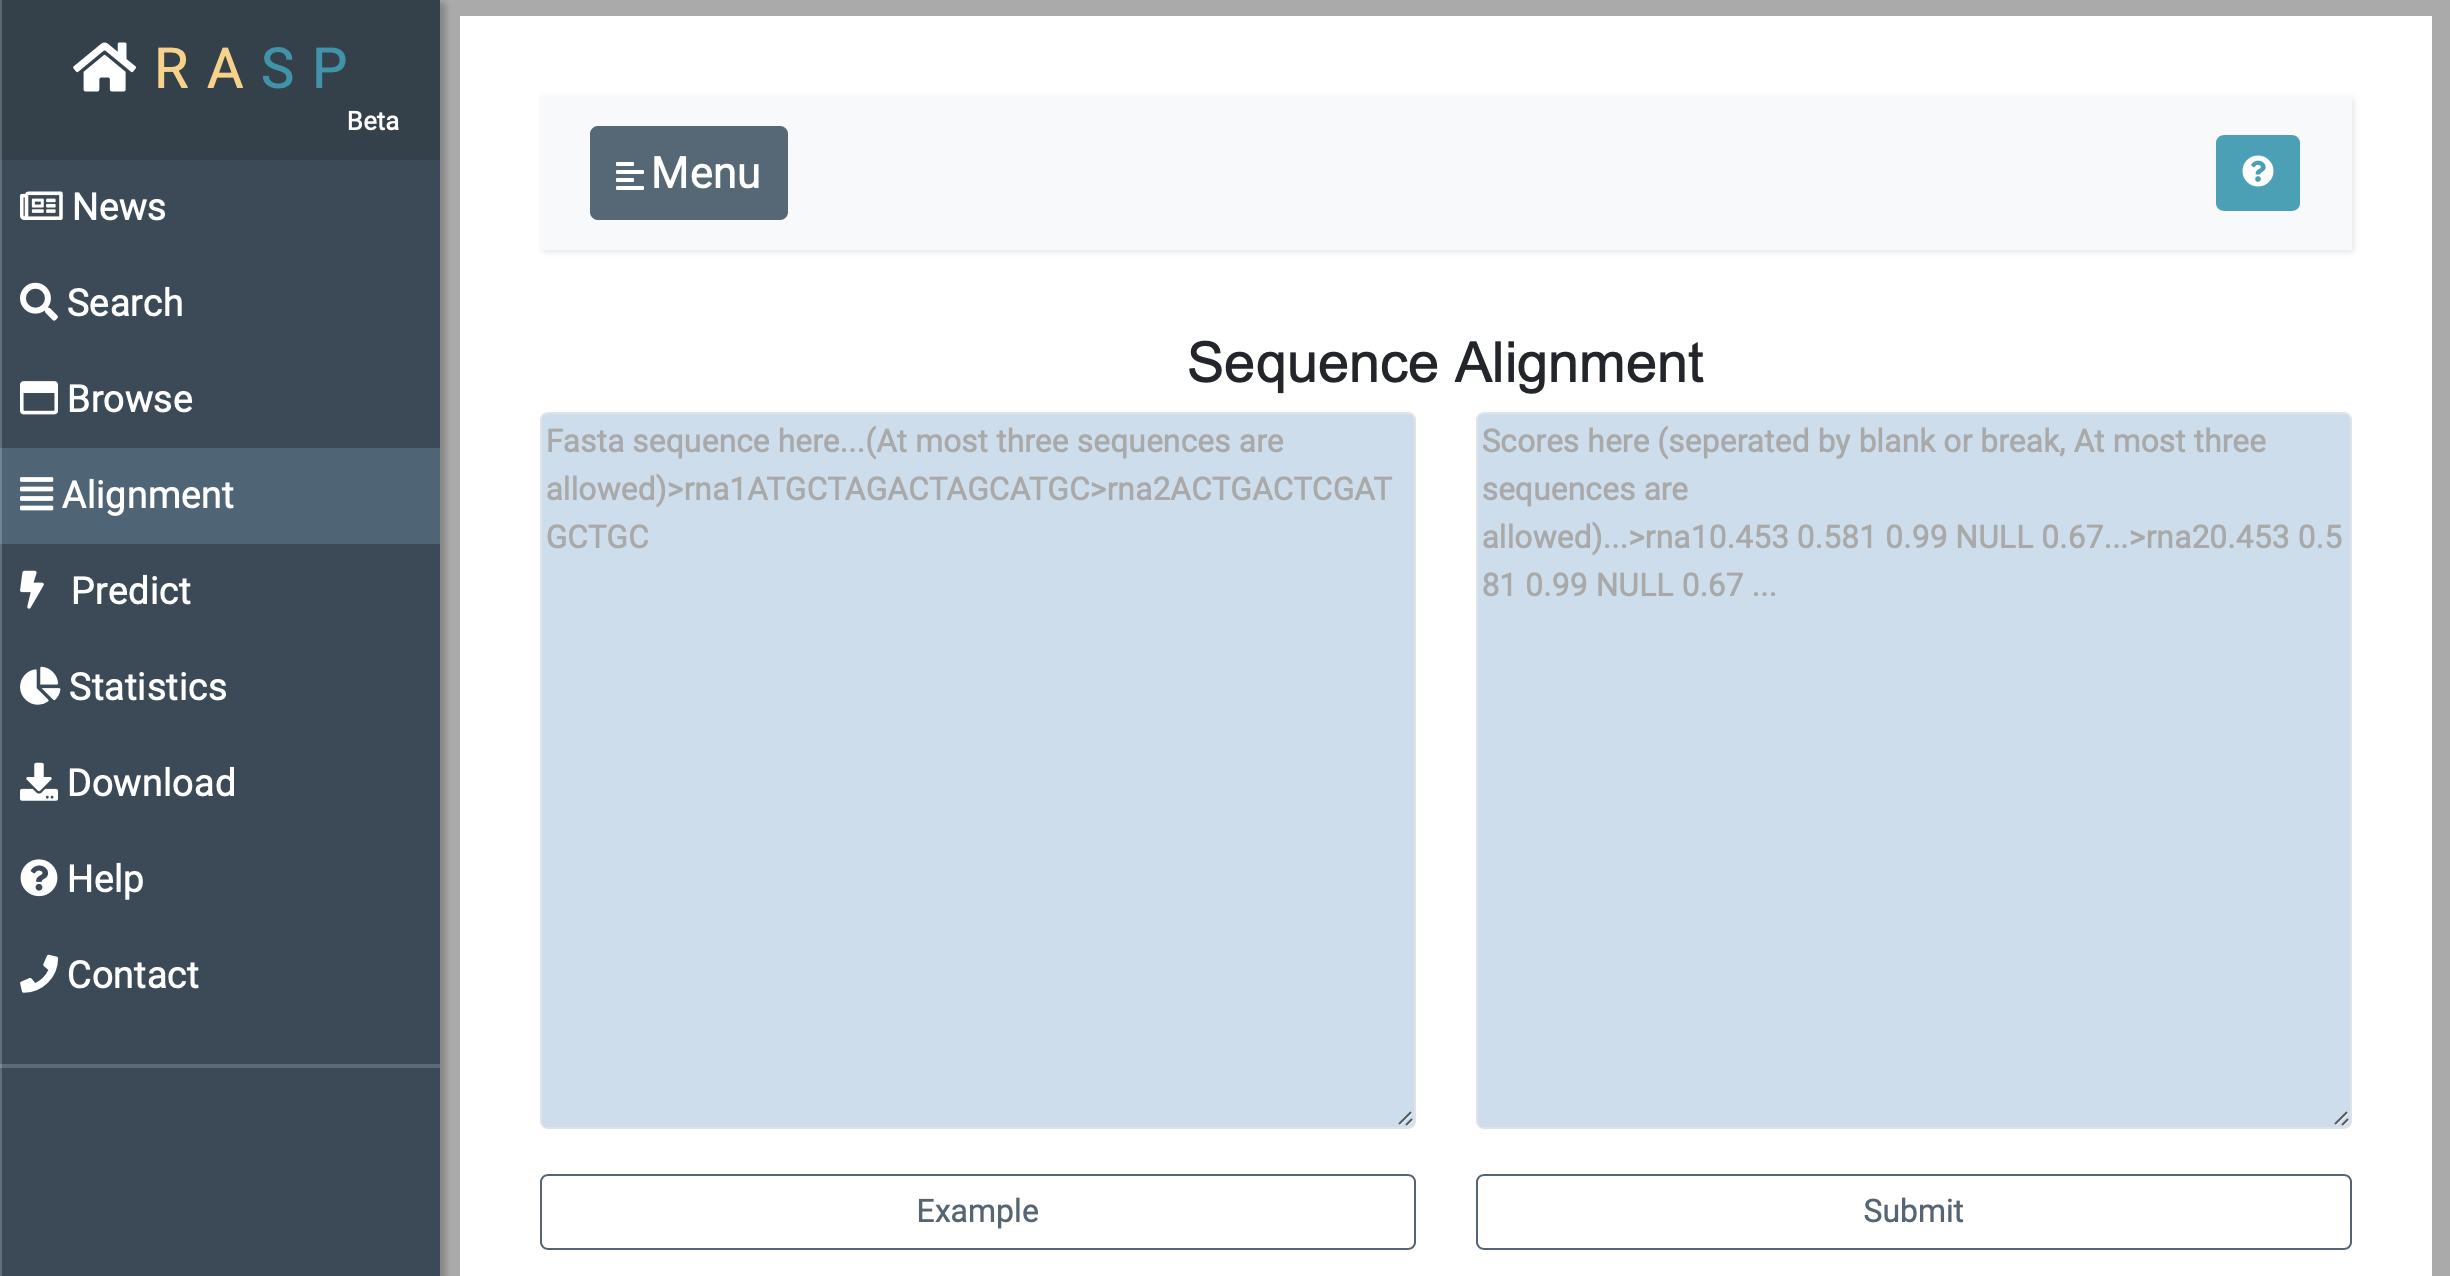
In addition to choosing different sequences to add to the alignment screen as we mentioned earlier, you can enter your own data directly into the alignment box. Input sequence on the left and input corresponding scores on the right.
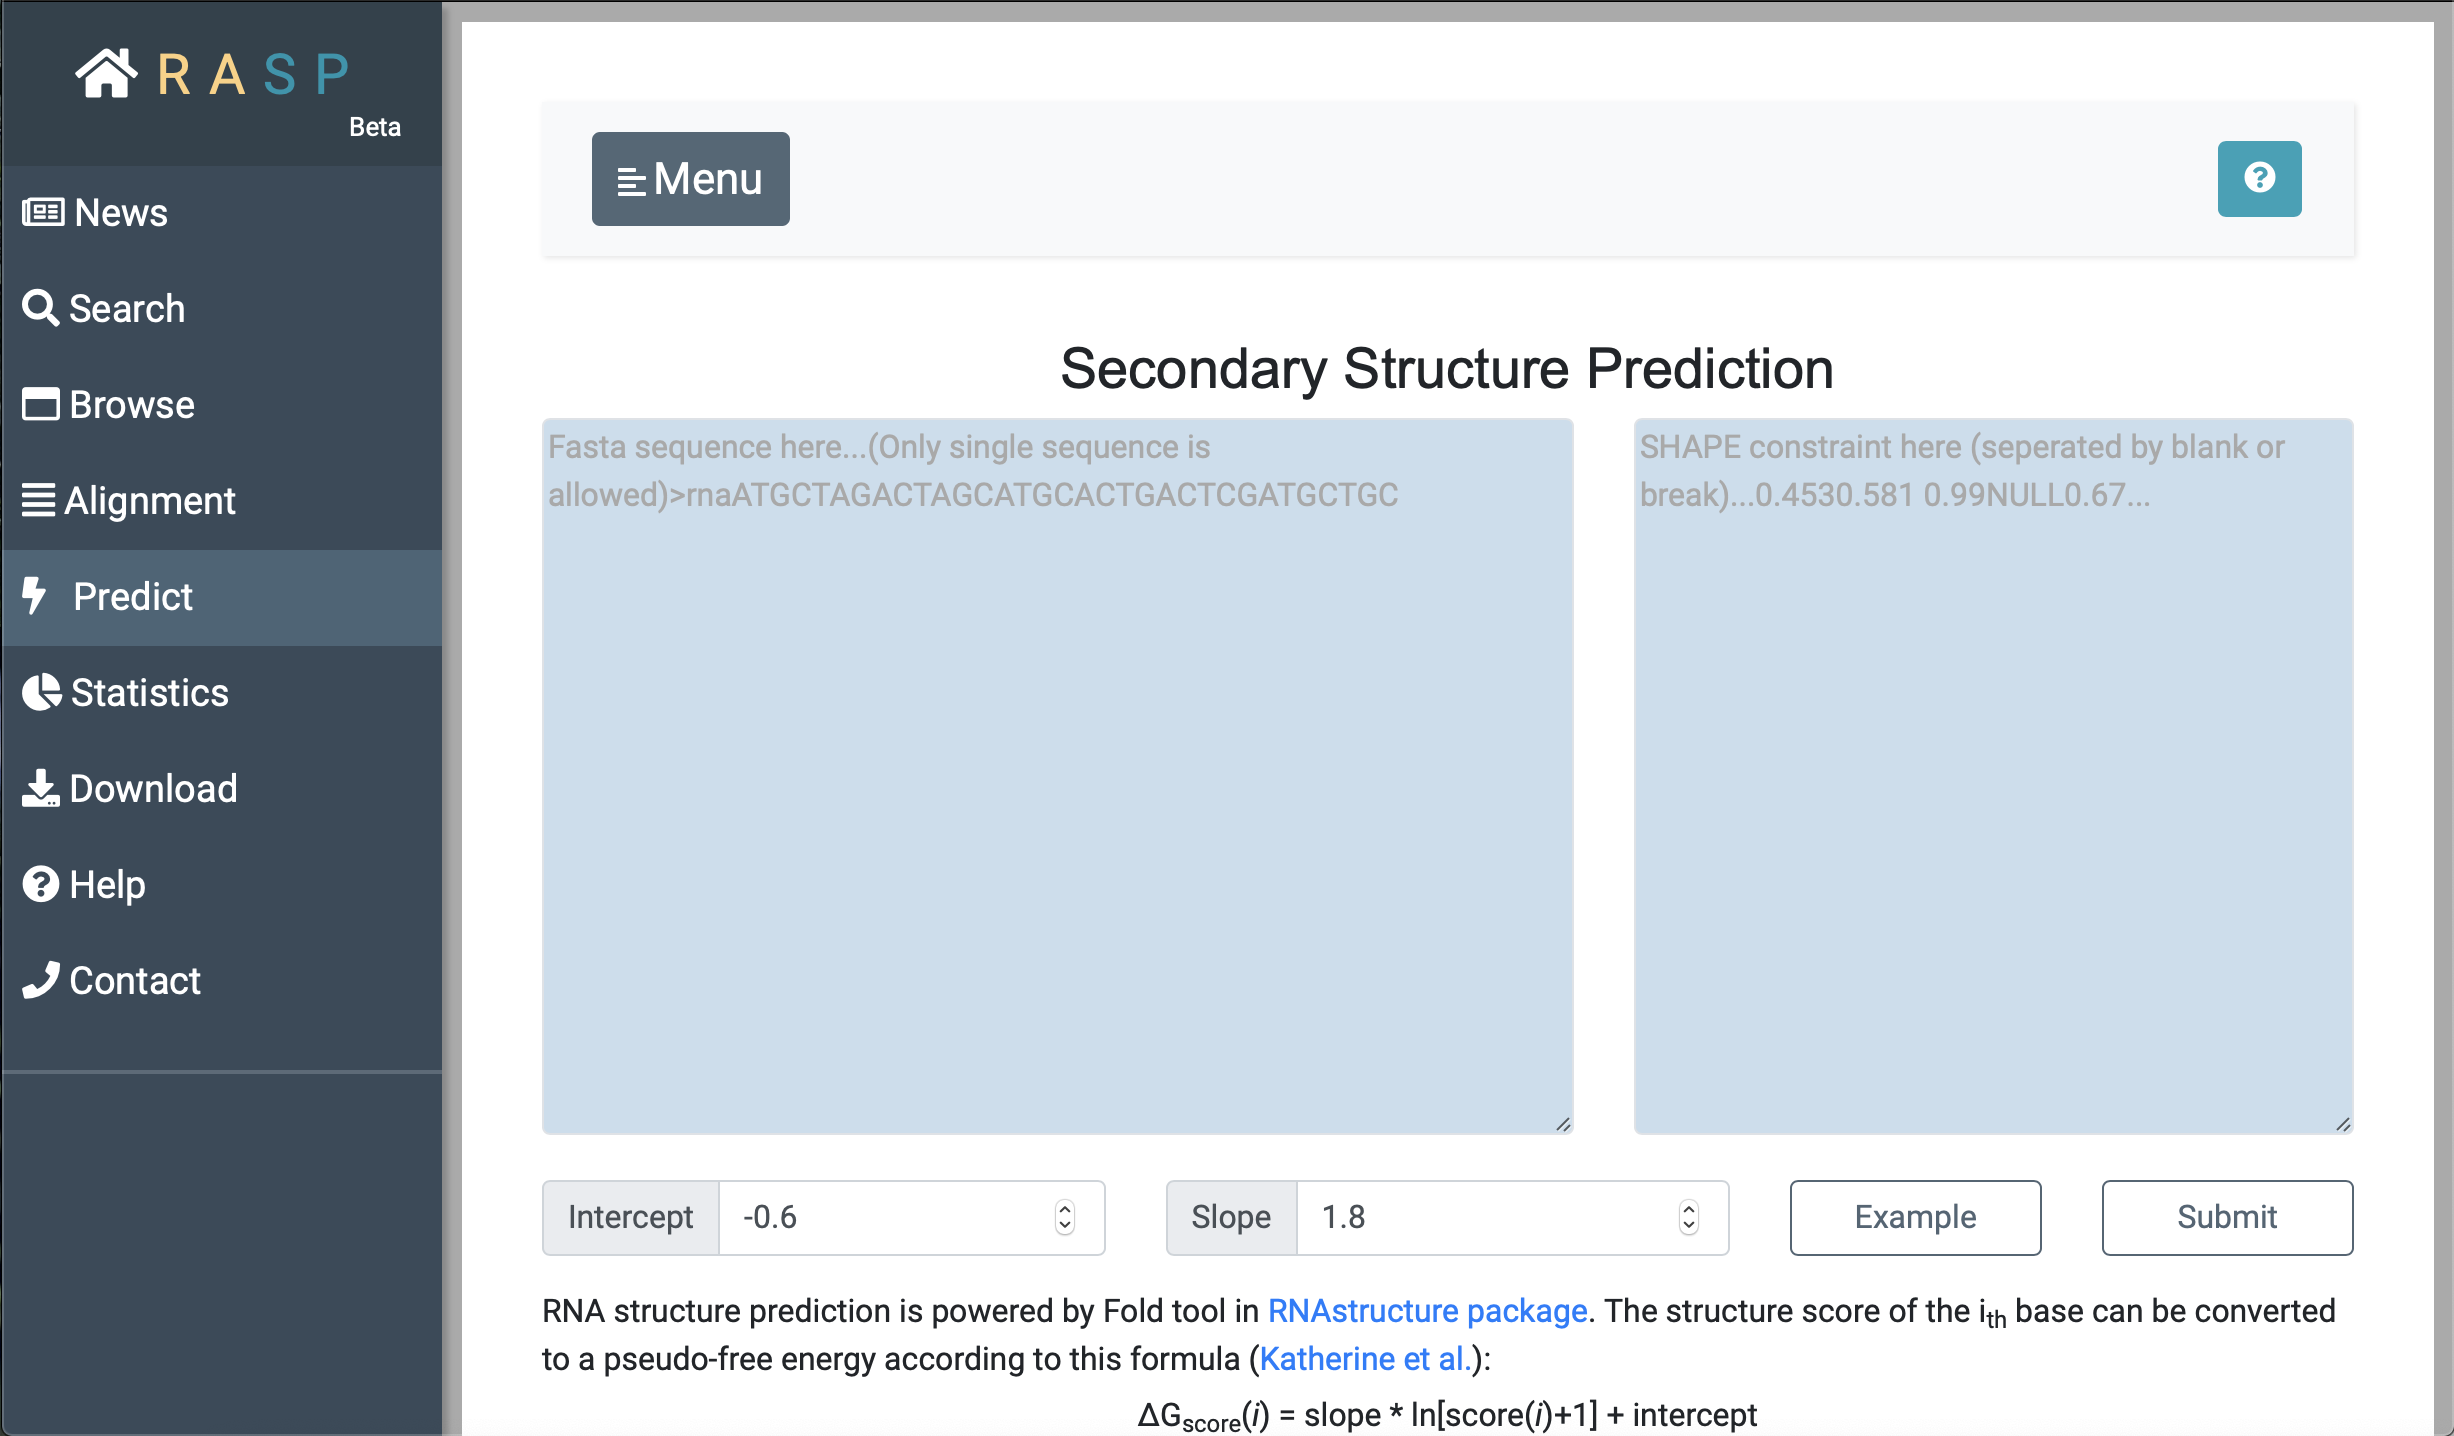
As with "Alignment", input the sequence on the left, input the corresponding score on the right, and set the desired parameters for 'Intercept' and 'Slop' to obtain the predicted RNA secondary structure.
|
Note: When you set your own scores, remeber to separate two decimal values by Space. |
5. What's in Statistics ?
Statistics stores the chemical reagent information of experiment, and the principle to get the data. There are three principles included in RASP, RT stop, cleavage and RT mutation.
Apart from this, Statistics supports distinguishing articles included by the chemical reagent and principle. Through clicking yellow text ( data calculated by us) or blue text (data given by original paper), you could directly go into the website of the original paper.

6. How to Download
Download section provides gene and annotation files, as well as original RT files and processed score files.
